2018issue C119
Wide-range breakout rules from chart volatility
This archive construction treats a breakout or moving-average crossover as incomplete until chart range, trend consistency, and a minimum high-to-low span have already passed as one eligibility gate.
- A defined technical entry is eligible only when it already sits on a wide-range chart that meets the scan's minimum span.
- Range is read in points on the right side of the chart, in addition to the main pattern, so narrow and choppy charts stay outside the procedure.
- The same gate requires a consistent, well-developed uptrend and keeps most instruments priced under $10 out of the scan.
- Inconsistent volatility and pop-and-drop action are treated as reasons to abstain, not as extra opportunity.
A single eligibility procedure
This archive construction treats entry as one eligibility procedure. A gap, cup breakout, ascending triangle, or moving-average crossover is incomplete until chart range, trend consistency, and a minimum high-to-low span have already passed as a single testable gate.
The breakout system is the unified entry, exit, and abstention procedure. It fires only when a wide-range chart breakout is present and the other construction filters have already passed.
Minimum span on a 15-day chart
On a 15-day chart, this construction treats a 20 percent high-to-low span as the minimum range to scan for. A wide-range chart is a chart whose high-to-low span meets that time-interval-specific minimum.
Under that 20 percent rule, a $20 instrument needs at least a $4 high-to-low span, illustrated as a $16 low and a $20 high. A 15-day illustration uses a $26 instrument with a nine-point range, described as roughly 30 percent.
Range is read on the right side of the chart
Range is measured in points on the right side of the chart, in addition to the main pattern. Narrow, choppy, small-range charts are treated as exceptionally hard to trade consistently.
Volatility position sizing is the pre-entry bound. It uses high-to-low chart span, price level, and consistency of movement to decide whether a signal is allowed to be taken.
REGI 15-day path with a nine-point range
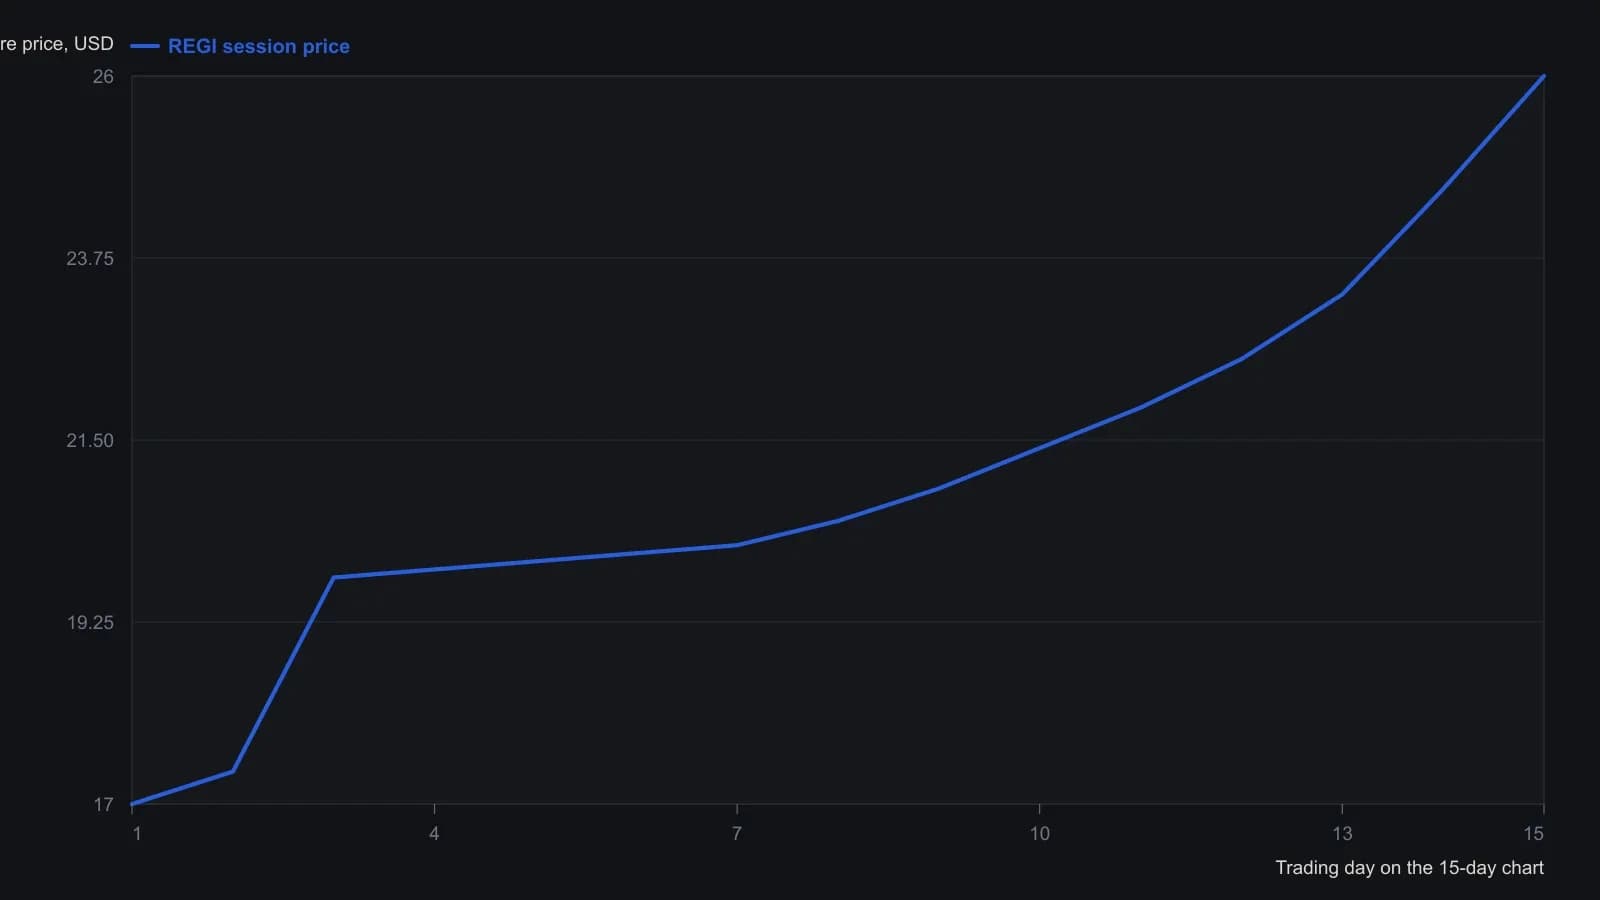
The source is a dense 15-minute candle plot, not a table. Bars were collapsed to one point per trading day so the series stays inside the digitizing cap. Calendar labels on the figure were too small to transcribe with certainty, so x is session order from left to right. Prices are approximate to about 0.3 dollars.
Uptrend and price-level filters
The same procedure requires a consistent, well-developed uptrend. The uptrend filter requires that the instrument already show that advance before a breakout or crossover is treated as eligible.
The construction excludes most instruments priced under $10 on the grounds that their volatility is hazardous.
Why wide-range charts are preferred
Wide-range charts are preferred in this construction for stated design reasons: more room to work, fewer false breakouts, and easier scaling into winning trades.
Volatility that lacks consistency is rejected as gambling. Pop-and-drop price action is identified as a path to being stopped out.
Where a moving-average crossover fits
A moving-average crossover is a defined chart condition that may generate a signal only after the range and uptrend filters have already qualified the instrument. It sits inside the same gate as the listed breakout forms and does not replace that gate.
Editorial reading of the construction
TradersWeek editorial: the archive is specifying construction order. The signal is allowed only after the range bound and the uptrend filter have already qualified the chart. That reading is editorial and is not a claim made by the archive about present-day markets.
All readings on this track · 25 readings
- 1988Two-sided optimization for volatility-scaled breakout rules
- 1990Weekly range volatility as a tactical regime filter
- 1993Heat first, then contract count on a weekly close-only breakout
- 1994Shared sigma for trend entries, retests and stops
- 1995The promised result as one testable trading procedure
- 2001Convert a survival ceiling into a volatility filter
- 2002Bound the next loss before the bear trade
- 2004Dollar-loss tolerance versus percent-of-equity stops
- 2004Bounded risk before entry: stop, size, and leverage
- 2006Position sizing as the pre-trade bound on loss and exposure
- 2006A trend-regime matrix for volatility position sizing
- 2011A premarket range checklist for opening-hour breakouts
- 2011Stop-defined share count on a clustered intraday short
- 2012Mechanical system design with strategy, signals, and size
- 2012Precommit size before a one-day policy shock
- 2013R-multiple expectancy, drawdown, and volatility position sizing
- 2014Constructing trend-aware slope-divergence rules
- 2014Pretrade drawdown fences and volatility sizing
- 2015Convert pip value into cash before a forex lot size is chosen
- 2016Expectancy as an execution skill rather than a backtest score
- 2017Volatility parity equalizes the ticket; implied volatility is a regime dial
- 2018Wide-range breakout rules from chart volatility
- 2019A structure-based stop, then resize or pass
- 2020A cash rule that zeros a trend book on extreme volatility and a short losing window
- 2025R-multiples before you size up