2001issue C071-5
Convert a survival ceiling into a volatility filter
Future peak-to-valley depth is the survival-critical unknown. Archive workflow maps monthly-return sigma to a typical worst drawdown and uses leverage to keep that depth inside a chosen pain threshold before capital is committed.
- Future peak-to-valley depth is the survival-critical unknown because it is an equity retracement from a prior high.
- A precomputed worst-drawdown estimate lets a later loss be treated as a planned event, which reduces the chance of exiting a book near a drawdown low.
- When a projected worst drawdown exceeds a chosen pain threshold and exposure can be changed, lowering leverage is the control that reduces expected future drawdowns.
- The four-sigma guideline maps monthly-return standard deviation to a typical worst peak-to-valley and is applied as a broad filter, not as a hard ceiling.
Why peak-to-valley depth is the unknown
Among expected return, drawdown length, and drawdown depth, future peak-to-valley depth is treated as the survival-critical unknown because it is an equity retracement from a prior high. Peak-to-valley drawdown is that retracement. It is the loss depth a book must be able to live through, not proof that the process has failed.
A precomputed worst-drawdown estimate is used so a later loss can be treated as a planned event rather than evidence the process has failed. That planning step reduces the chance of exiting a book near a drawdown low.
Monthly-return sigma as the input
The volatility input is monthly-return sigma, the standard deviation of monthly percentage returns versus the sample mean. Larger monthly-return scatter is the quantity later mapped to a larger worst peak-to-valley.
A drawdown limit is a pre-entry bound on acceptable peak-to-valley loss. It is used to accept, scale, or reject exposure before capital is committed. Volatility position sizing sets exposure from account equity and that monthly-return scatter so a budgeted peak-to-valley remains a filter rather than a surprise.
Historical mappings to a four-sigma guideline
In a 50-fund mixed equity-and-bond sample from January 1994 through August 2000, worst peak-to-valley rose with monthly-return standard deviation. A through-origin linear fit had slope 3.85 and R-squared 0.75, and most funds clustered between three and five times that monthly sigma.
A sample of more than 100 futures managers produced a through-origin slope of 2.84 and R-squared 0.45, with about 90 percent of worst-drawdown-to-monthly-sigma ratios below four. A 30-name hedge-fund sample from June 1995 through June 1998 produced slope 3.0, R-squared 0.69, and 83 percent below the same four-times line.
The planning rule of thumb sets the worst peak-to-valley equal to four times monthly-return standard deviation. That four-sigma guideline is applied as a broad filter across funds, futures managers, hedge funds, and stock indexes rather than as a hard ceiling.
When the multiple is larger
The four-times mapping is described as most reliable on well-diversified books. Concentrated or intercorrelated stock books, daily rather than monthly data (near five times sigma), and an update of volatile funds after the 2001 drop (near six times sigma) produced larger multiples.
A four-sigma planning number can still be exceeded. For diversified books a drawdown approaching three to five times monthly sigma is described as typical in almost every rolling five-year span, so the chance of eventually meeting a budgeted worst drawdown is treated as certain.
Leverage as the control on future drawdowns
When a projected worst drawdown exceeds a chosen pain threshold and exposure can be changed, lowering leverage is the control that reduces expected future drawdowns. Lowering leverage means smaller position size per unit of capital.
Return volatility, and therefore the implied drawdown budget, rises with larger futures or options positions per unit of capital, with more volatile or less liquid equity concentration, and with longer duration or lower-quality credit exposure. Leverage control changes position size relative to capital so return volatility, and the implied worst-drawdown depth, stay inside the chosen pain threshold.
Nasdaq peak-to-valley holes in units of monthly-return sigma
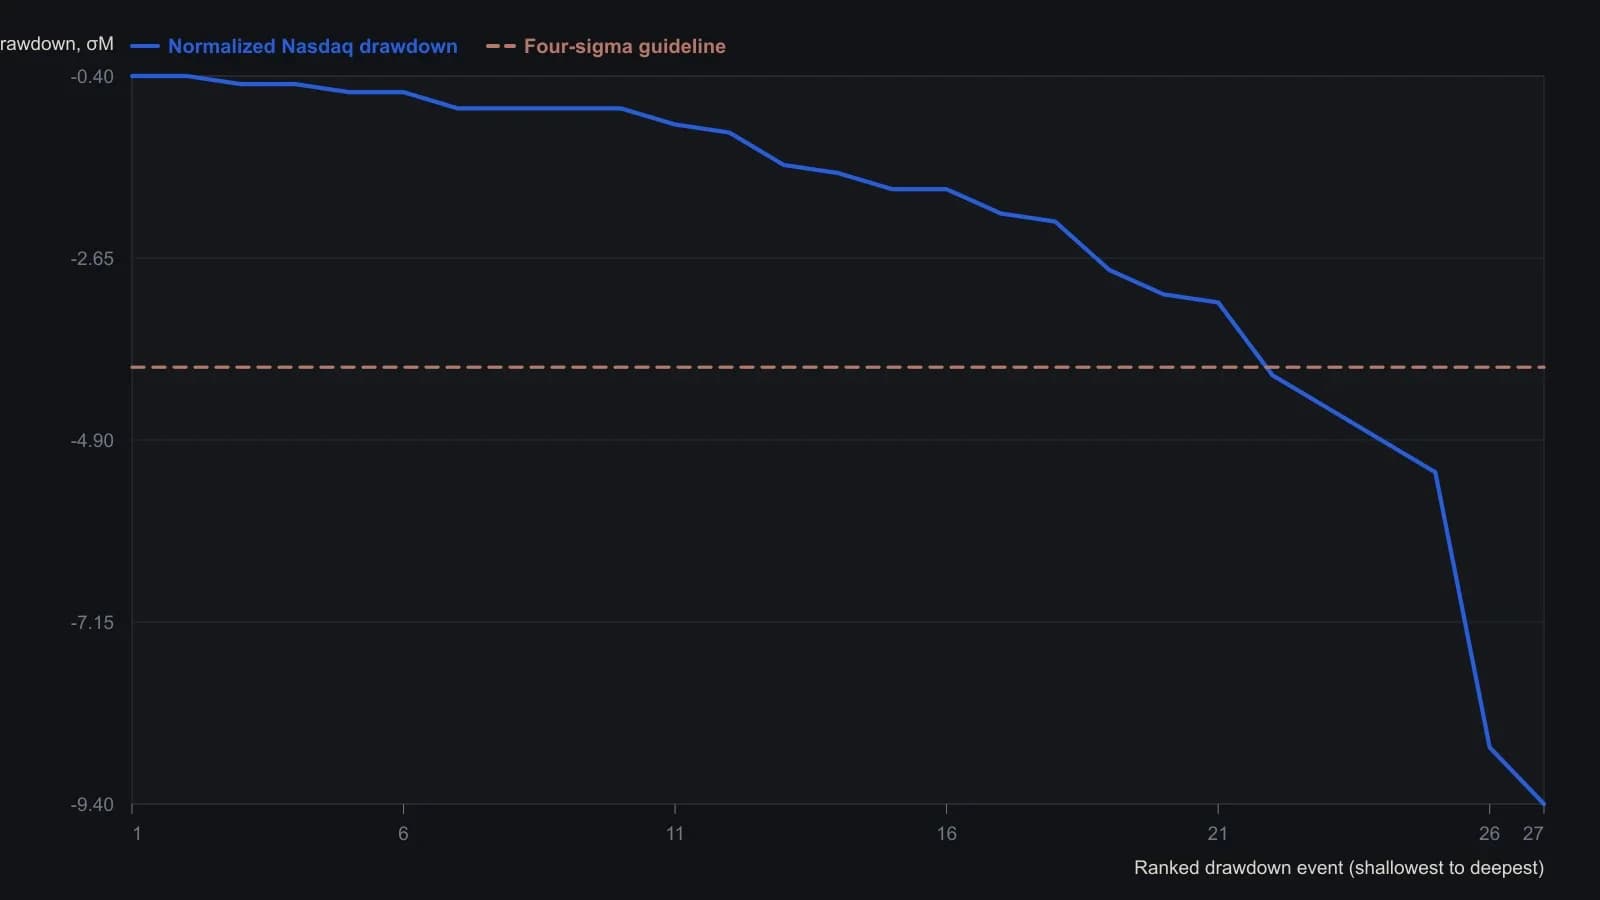
Each bar is that event’s peak-to-valley depth divided by 6.19 percent, the monthly-return standard deviation stated for the Nasdaq Composite. Heights are approximate to 0.1 sigma. Chande warns that future depth can exceed any such ranking, as the two rightmost bars already do.
All readings on this track · 25 readings
- 1988Two-sided optimization for volatility-scaled breakout rules
- 1990Weekly range volatility as a tactical regime filter
- 1993Heat first, then contract count on a weekly close-only breakout
- 1994Shared sigma for trend entries, retests and stops
- 1995The promised result as one testable trading procedure
- 2001Convert a survival ceiling into a volatility filter
- 2002Bound the next loss before the bear trade
- 2004Dollar-loss tolerance versus percent-of-equity stops
- 2004Bounded risk before entry: stop, size, and leverage
- 2006Position sizing as the pre-trade bound on loss and exposure
- 2006A trend-regime matrix for volatility position sizing
- 2011A premarket range checklist for opening-hour breakouts
- 2011Stop-defined share count on a clustered intraday short
- 2012Mechanical system design with strategy, signals, and size
- 2012Precommit size before a one-day policy shock
- 2013R-multiple expectancy, drawdown, and volatility position sizing
- 2014Constructing trend-aware slope-divergence rules
- 2014Pretrade drawdown fences and volatility sizing
- 2015Convert pip value into cash before a forex lot size is chosen
- 2016Expectancy as an execution skill rather than a backtest score
- 2017Volatility parity equalizes the ticket; implied volatility is a regime dial
- 2018Wide-range breakout rules from chart volatility
- 2019A structure-based stop, then resize or pass
- 2020A cash rule that zeros a trend book on extreme volatility and a short losing window
- 2025R-multiples before you size up