1992issue C011-7
Stop-order slippage as an execution cost filter
A triggered futures stop-order is filled as an unpriced market order, so the signed fill distance can add to or subtract from the trigger. In 297 cleaned stop-order trades, mean slippage was $38.16 per contract and was substantially larger than commissions paid by large firms. Editorial view: convert expected fill distance into dollars per contract and stack that slippage against commission before treating a technical trigger as executable.
- A futures stop-order becomes an unpriced market order at the trigger, so the signed fill distance can be positive or negative.
- Across 297 stop-order trades in 11 commodity futures, mean slippage was $38.16 per contract, with commodity means from $13.63 to $77.92.
- A median regression associated larger slippage with a wider daily range, a New York venue, and a higher order-size-to-volume ratio; volume alone was not significant at the 5% level.
- Editorial view: convert expected fill distance into dollars per contract and stack that slippage against commission before treating a technical trigger as executable.
How a futures stop-order is filled
A stop-order is an instruction that becomes an unpriced market order once the contract trades at or through a specified trigger.
Once a futures stop is triggered it is filled as a market order with no price limit, so the signed fill distance can be positive or negative.
How slippage was measured
Slippage is the dollar gap between the stop trigger and the actual fill after scaling by contract size.
In this sample, slippage in dollars per contract was the contract-size-scaled gap between the target and the volume-weighted average fill, with the sign reversed for sells versus buys.
The cleaned sample
After market orders, limit orders, and open-triggered stops were removed, the sample was 297 stop-order trades in 11 commodity futures from July 1984 through December 1986.
Fill distance in dollars per contract
Mean slippage across all 297 trades was $38.16 per contract, commodity means ran from $13.63 to $77.92, and the largest single observation was $700.
Positive and negative slippage
Positive slippage occurred on 189 of 297 trades; zero or negative slippage occurred on 108.
Gold showed positive slippage on 90% of its trades, while Treasury bills showed positive slippage on only 29%.
Single-price and multi-price completion
The entire order filled at one price in 74% of trades, while 78 of 297 required more than one price to complete.
Conditions associated with larger slippage
Daily range is the session high-low span expressed in dollars per contract. Order-size-to-volume is contracts in the order divided by that day's contract volume.
A median regression associated larger slippage with a wider daily range, a New York venue dummy, and a higher order-size-to-volume ratio; volume alone was not significant at the 5% level.
Holding other regressors fixed, the New York dummy added $10.571 of median slippage per contract relative to Chicago, and the order-size-to-volume coefficient was 839.25.
Slippage next to commission
Measured stop slippage for this large technical account was about double a contemporaneous $17-per-contract average-trader figure and was substantially larger than commissions paid by large firms.
Reading the sample as a filter
Editorial view: market-impact is price movement associated with executing size, especially when similar stops trigger together. The sample's order-size-to-volume term is the size pressure that belongs in that filter, alongside daily range and venue. Commission analysis then sits on top of the dollar slippage figure so that implementation cost, not the technical trigger alone, decides whether the order is treated as executable.
Mean stop-order slippage by commodity
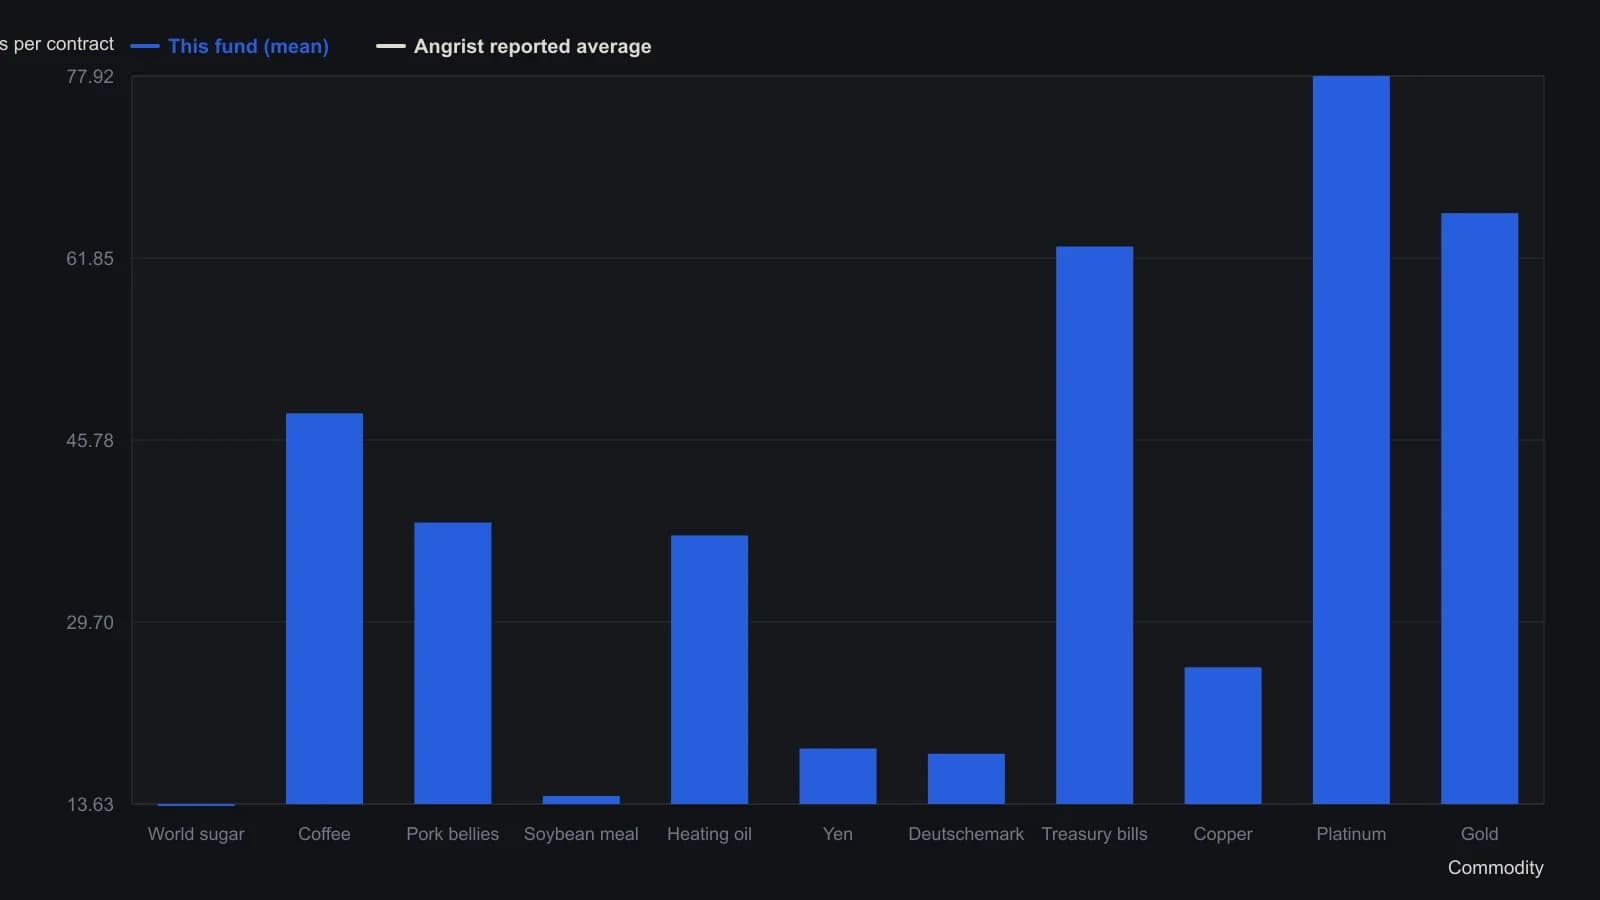
297 stop-order trades from one managed futures fund, July 1984–December 1986. Market and limit orders were dropped, as were stops triggered on the open. Slippage is signed dollars per contract from the weighted-average fill versus the stop trigger. The $17 reference is the single Angrist average for these same markets, not a per-commodity series.
All readings on this track · 32 readings
- 1985Matching ticket size to negotiable commission schedules
- 1985Minimum tickets can price a small book out of its own exit
- 1992Stop-order slippage as an execution cost filter
- 1993Cost-aware walk-forward evaluation of pattern-detector signals
- 2001Audit high-turnover operating conditions as one procedure
- 2002Front-load futures commission and slippage
- 2005Inactive account fees as hidden implementation cost
- 2010A pre-trade liquidity screen for futures contracts
- 2011Currency option venues, spreads, clearing, and premium cost
- 2012Filter futures contracts by liquidity and implementation cost
- 2012Futures commission versus one tick of cost
- 2012Ranking futures liquidity for executable orders
- 2013Filter option day trades by spread, volume, and fees
- 2013Filter futures by liquidity, open interest, and effective margin
- 2014Book futures data fees as implementation cost
- 2015Use a futures liquidity rank as a pre-trade checklist
- 2015Filter unexecutable futures by liquidity, open interest, and margin
- 2015Futures liquidity ranking as an execution filter
- 2015Filtering option trades by bid-ask width
- 2016Exchange quote fees as execution costs and liquidity filters
- 2016Filter futures by liquidity, open interest, and margin cost
- 2016Comparing dollar-index futures execution costs and liquidity
- 2016A futures liquidity ranking as a screen for executable orders
- 2017Filter a futures board by liquidity, open interest, and implementation cost
- 2017Filter futures contracts by liquidity and margin cost
- 2017How residency rules raise futures implementation costs
- 2018Screen listed futures by liquidity, open interest, and margin
- 2018Contract selection is the first filter on competing bitcoin futures
- 2018Filter futures execution by liquidity and margin
- 2018Commission analysis for brokerage execution costs
- 2019Ranking futures liquidity before you size the order
- 2020Brokerage selection as an implementation-cost problem