2016issue C0655
Filter futures by liquidity, open interest, and margin cost
Editorial view: treat a futures chart as untradeable until the contract clears a three-part execution screen. The archive workflow ranks how readily the book can be transacted, checks whether open interest can absorb the size, and compares how much capital the same multi-year dollar range consumes.
- Relative contract liquidity is a descending score of how readily a listed futures book can be transacted, assembled from contracts to trade, outstanding open interest, and a volume factor.
- Contracts to trade rescale each listing so a three-year extreme price move represents a comparable dollar amount, then open interest is the capacity input for whether that size can be absorbed.
- Effective percent margin is dollar margin divided by the three-year range of contract dollar value, expressed as a percentage, and is compared with stated percent margin to show how much capital a contract ties up.
- The liquidity, size, and margin columns are proportional measures that are meaningful only when compared with other contracts in the same column.
Three screens before a futures chart is executable
Editorial view: TradersWeek treats a futures chart as untradeable until the contract clears a three-part execution screen. That screen is an activity-based liquidity filter, an open-interest capacity check, and a margin-cost comparison that shows how much capital the same multi-year dollar range consumes.
A listed future’s relative liquidity rank is assembled from contract point value, a three-year extreme price move, open interest, and a volume adjustment.
How relative contract liquidity is assembled
Relative contract liquidity is a descending score of how readily a listed futures book can be transacted. It is assembled from an equal-dollar size multiple, outstanding open interest, and a volume adjustment.
The contracts-to-trade figure is that size multiple. It scales each listing so tick dollar value times the three-year maximum price excursion represents a comparable dollar move.
Relative contract liquidity is also specified as the contracts-to-trade count multiplied by total open interest multiplied by a volume factor.
The volume factor
The volume adjustment in that rank is described as a factor that commonly falls between one and four when volume is unusually low or high.
One stated form of the volume factor is the greater of one and the exponential of log volume divided by log 5,000, minus two. That multiplier adjusts the liquidity score when volume is unusually thin or crowded.
Open interest as a capacity check
Open interest is the stock of outstanding futures used as a capacity input when judging whether size can actually be absorbed.
In the relative-liquidity specification, that open-interest stock is multiplied by the contracts-to-trade count and by the volume factor. The product is the capacity-aware rank of how readily the outstanding book can be transacted.
Margin cost against the same dollar range
Effective percent margin equals dollar margin divided by the three-year range of contract dollar value, then multiplied by one hundred.
Stated percent margin and effective percent margin are comparison tools for how much capital a contract ties up relative to its historical dollar range.
Posted and effective margin by listed futures contract
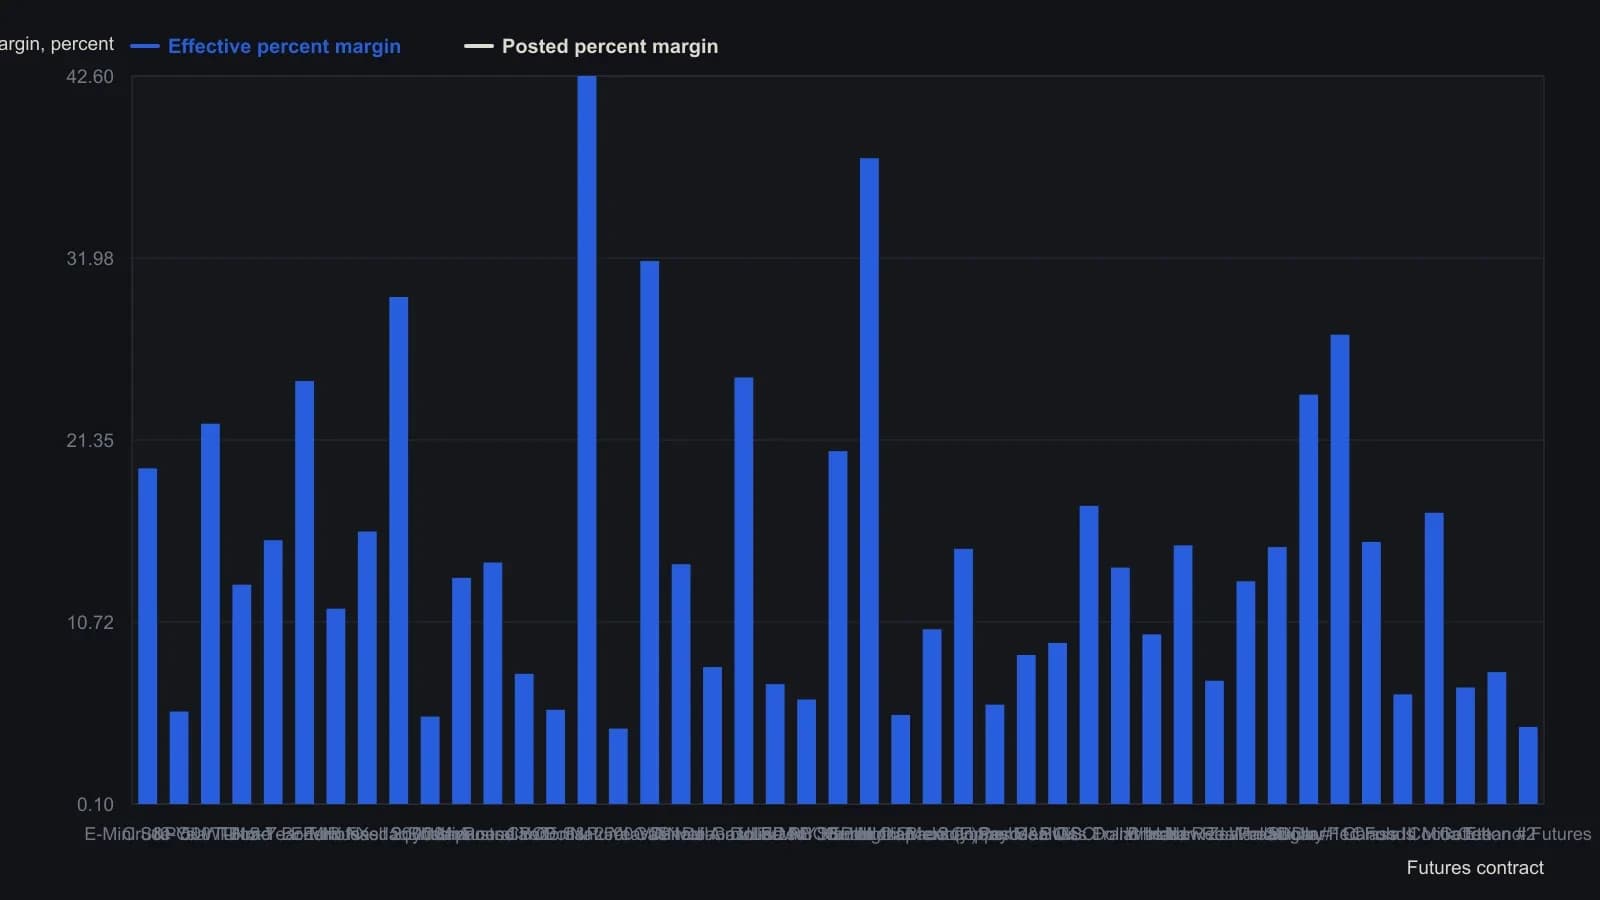
Values are the printed table, not the CBOT trading-floor photograph. Relative-liquidity dots are a graphic rank and are omitted because several top names overflow the printed scale. Each column is only comparable across contracts in the same monthly ranking.
Read each column only against other contracts
The liquidity, size, and margin columns are described as proportional measures that are meaningful only when compared with other contracts in the same column.
The relative-liquidity list is ordered so that contracts at the top are those whose outstanding books are easiest to transact and those at the bottom are the hardest.
Share turnover as an equity liquidity proxy
For equities, period volume as a percentage of shares outstanding is presented as a turnover-rate proxy for trading liquidity.
What the screen is for
Editorial view: the three columns answer whether an order is executable and how much capital the same multi-year dollar range consumes, not whether the plotted idea is right. A listing is chosen only after the liquidity rank, the open-interest capacity check, and the margin-cost comparison have been read against other contracts.
All readings on this track · 32 readings
- 1985Matching ticket size to negotiable commission schedules
- 1985Minimum tickets can price a small book out of its own exit
- 1992Stop-order slippage as an execution cost filter
- 1993Cost-aware walk-forward evaluation of pattern-detector signals
- 2001Audit high-turnover operating conditions as one procedure
- 2002Front-load futures commission and slippage
- 2005Inactive account fees as hidden implementation cost
- 2010A pre-trade liquidity screen for futures contracts
- 2011Currency option venues, spreads, clearing, and premium cost
- 2012Filter futures contracts by liquidity and implementation cost
- 2012Futures commission versus one tick of cost
- 2012Ranking futures liquidity for executable orders
- 2013Filter option day trades by spread, volume, and fees
- 2013Filter futures by liquidity, open interest, and effective margin
- 2014Book futures data fees as implementation cost
- 2015Use a futures liquidity rank as a pre-trade checklist
- 2015Filter unexecutable futures by liquidity, open interest, and margin
- 2015Futures liquidity ranking as an execution filter
- 2015Filtering option trades by bid-ask width
- 2016Exchange quote fees as execution costs and liquidity filters
- 2016Filter futures by liquidity, open interest, and margin cost
- 2016Comparing dollar-index futures execution costs and liquidity
- 2016A futures liquidity ranking as a screen for executable orders
- 2017Filter a futures board by liquidity, open interest, and implementation cost
- 2017Filter futures contracts by liquidity and margin cost
- 2017How residency rules raise futures implementation costs
- 2018Screen listed futures by liquidity, open interest, and margin
- 2018Contract selection is the first filter on competing bitcoin futures
- 2018Filter futures execution by liquidity and margin
- 2018Commission analysis for brokerage execution costs
- 2019Ranking futures liquidity before you size the order
- 2020Brokerage selection as an implementation-cost problem