1991issue C071-8
Evaluating a trailing stop against a coin-flip entry
Hold the entry to a coin-flip-entry schedule and the trailing-close-stop becomes a measuring tool. Stop distance, hard-stop versus soft-stop execution, market drift, and commission can then be scored separately before anyone credits skill.
- A trailing-close-stop on a coin-flip-entry schedule scores stop distance without using a price forecast to choose the entry date.
- A 1-point stop was touched 885 times; a soft-stop close would have skipped 412 of those exits, and three of seven next-open hard-stop cases were later classed as a false-alarm-stop.
- One hundred replications at each width from 1 through 4 points shifted terminal outcomes toward more favorable endings as the stop widened, yet three 1-point equity paths shared no common profit-and-loss shape.
- A direction-randomized-trial at 1 point recorded about 56 trades, about 90 points of stop-slippage, and a 0.1-point commission assumption that left the average slightly above break-even.
A coin-flip-entry and a trailing-close-stop
The long-side procedure entered on a randomly chosen close and used no price forecast to pick the date. A trailing-close-stop was reset each day to a fixed point distance below the latest close and was checked only at the next close. The position exited at the close if that close was below the stop, then waited another random number of days before the next entry.
The sample was 1880 daily closes of a broad equity index from 1983 onward. Idle gaps were drawn from 1 to 60 days. Stop distances of 1, 2, 3, and 4 points were compared.
Daily moves and stop width
Mean absolute day-to-day change in that sample was 0.714 points, with 44.2 percent of changes smaller than 1 point and 69.5 percent smaller than 2 points.
Hard-stop fills versus a soft-stop close
A 1-point stop was counted as touched 885 times. Waiting for the close under a soft-stop rule would have skipped 412 of those exits. Seven cases would have been stopped on the next open. Three of those seven were later classed as a false-alarm-stop.
A 2-point hard-stop produced 452 terminations and 202 false-alarm-stop cases, with three next-open exits each better than remaining until the close. Stop-slippage is the point gap between that close-based exit and the fill a rigid stop order would have received.
Replications, drawdown, and path shape
One hundred independent replications were run at each stop width from 1 through 4 points. Histograms of terminal outcomes shifted toward more favorable endings as the stop widened.
Mean peak drawdown rose only from about 12 points at a 1-point stop to about 18 points at a 4-point stop, while worst-case drawdown declined as the stop widened and the win share stayed near two winners in every five trades.
Three separately drawn 1-point-stop equity paths shared no common profit-and-loss shape, so a single run cannot stand in for the distribution of outcomes.
Drift, the short side, and commission
Over the same seven-year window the index advanced about 158 points with 1019 up days versus 862 down days. Short-only replications shifted toward losses as the cover widened, and the win share fell from about two of five trades long to about one of three trades short.
When long versus short was assigned by whether the trade day was odd or even, the direction-randomized-trial could not lean on a known bull or bear drift. A 1-point stop recorded about 56 trades split equally by side, an average net of about 8 points, about 90 points of stop-slippage, and a 0.1-point commission assumption that left the average slightly above break-even.
Cumulative P&L on one 1-point random-entry stop run
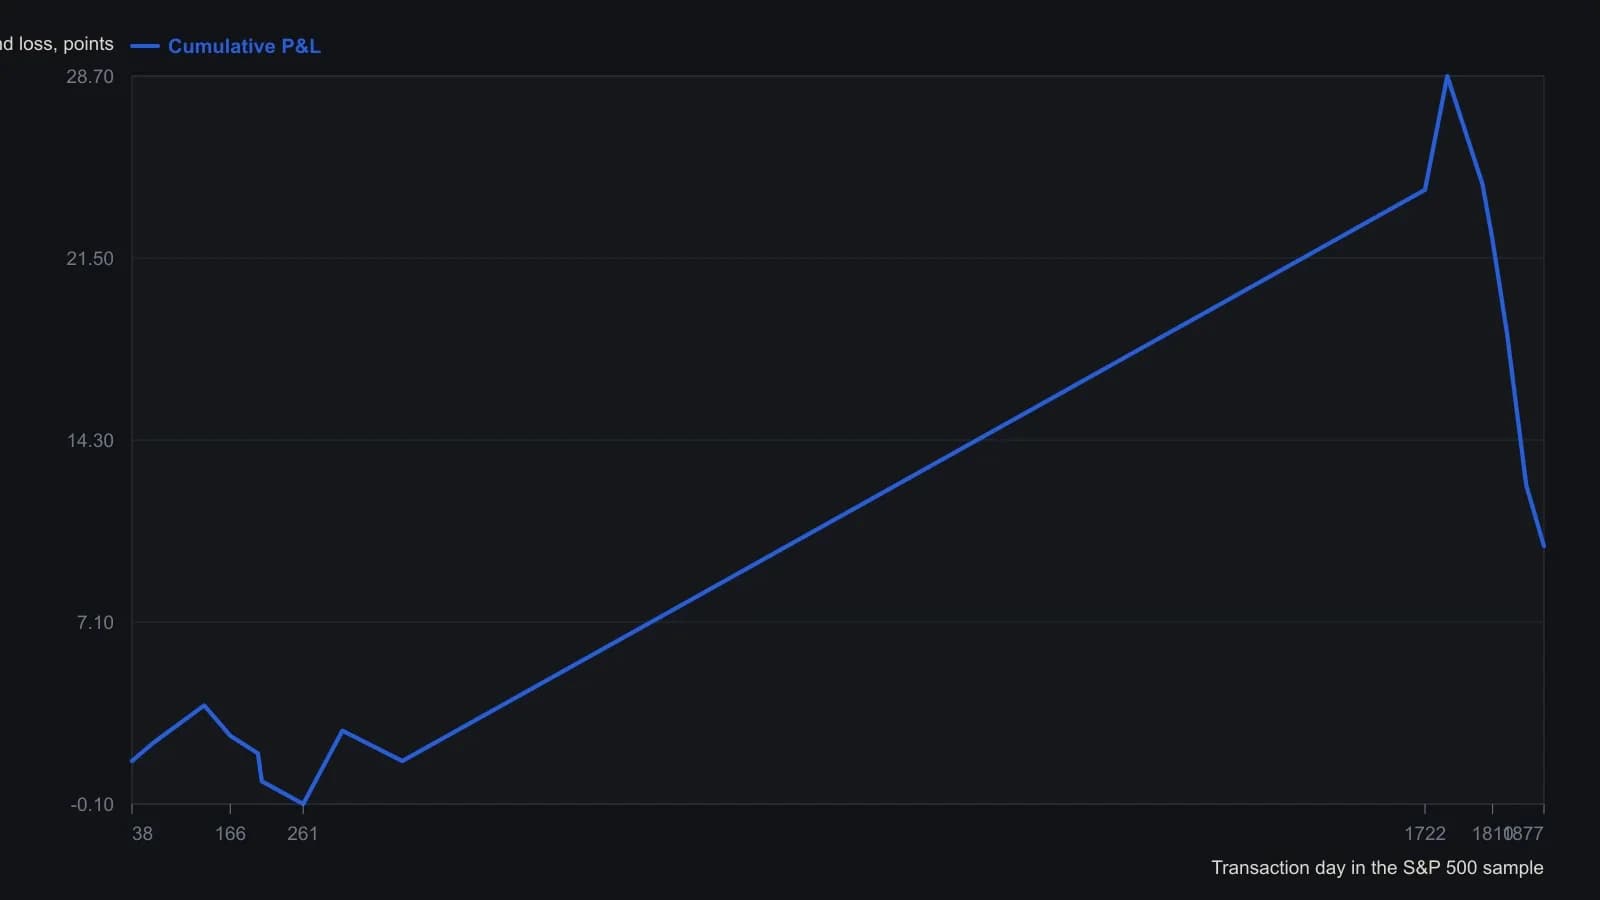
Figure 1 prints only the first nine and last seven trades of a 54-trade run. Entry waits a random 1–60 days after each exit; the stop trails the close by 1 point and is filled at the close. The omitted middle is not interpolated.
All readings on this track · 6 readings
- 1986Skill score versus a coin-flip forecast baseline
- 1991Evaluating a trailing stop against a coin-flip entry
- 2004Evaluating trend rules against no-skill baselines
- 2005Evaluating systems with walk-forward analysis, robustness testing, and coin-flip baselines
- 2015Trade-tape entropy versus a coin-flip no-skill baseline
- 2017A coin-flip timed exit as the skill floor for trend and mean-reversion