2016issue C0756
A futures liquidity ranking as a screen for executable orders
A published futures ranking combines contract size, a multi-year price excursion, open interest, and a low-volume adjustment so listed markets can be compared as easier or harder to buy and sell. Read the table first as an execution screen, then use the size and margin columns only relative to other rows.
- Relative-contract-liquidity is shown as a descending dot count, so markets at the top of the list are presented as easier to buy and sell than markets at the bottom.
- Contracts-to-trade-for-equal-dollar-profit size-normalizes listed futures to a common dollar-profit unit by combining tick dollar value with a three-year maximum price excursion.
- Open-interest-weight and the volume-factor enter the rank so standing inventory and quiet volume can pull a contract down even when its notional size looks large.
- Nominal percent margin and effective-percent-margin are shown side by side so posted margin can be compared with a three-year dollar range instead of treated as a like-for-like headline rate.
What the published ranking combines
A published futures liquidity ranking is built by combining contract point value, a three-year maximum conceivable price move, open interest, and a low-volume adjustment factor. The chart is framed as a speculator reference that compares per-contract profit potential with how easily contracts can be bought or sold.
Each column is meaningful only relative to other entries in that column. Relative-contract-liquidity is a descending ranking of listed futures by how readily their contracts can be bought and sold, shown as a proportional dot count rather than a standalone score.
Relative liquidity as dots
Relative-contract-liquidity is displayed as a descending dot count so markets at the top of the list are presented as easier to buy and sell than markets at the bottom. The dots are a comparative screen for whether an order looks executable, not a score that can be read in isolation.
Size, open interest, and the volume factor
Contracts-to-trade-for-equal-dollar-profit is a size-normalization that asks how many contracts of one market are needed to match another market's potential dollar move, using tick value and a multi-year maximum price excursion. In the published table it equals tick dollar value times the three-year maximum price excursion, so listed markets are size-normalized to a common dollar-profit unit.
The ranking multiplies that contracts-to-trade figure by total open interest and by a volume-factor. Open-interest-weight is the outstanding contract inventory used inside the rank, so markets with more standing positions rank as easier to trade than equally sized but thinner books.
The volume-factor is a low-activity adjustment, usually a small integer or an exponential of volume versus a 5,000-contract reference, that down-weights quiet futures in the ranking. It is defined as the greater of 1 or exp(ln volume - 2) / ln 5000.
Posted margin versus three-year range
Nominal percent margin and effective-percent-margin are shown side by side so a trader can compare posted margin against three-year dollar range rather than treating headline margin rates as comparable across products.
Effective-percent-margin is margin dollars divided by the three-year range of contract dollar value, then scaled to a percent. The column compares how efficiently posted margin covers historical range across markets with different volatility.
A July 2016 listing and a stock analogue
In the July 2016 listing, equity-index and energy contracts such as E-mini S&P 500, 10-year T-note, and WTI crude occupy the densest liquidity rows, while several agricultural and lesser metals contracts sit near the bottom with one dot or none. That snapshot is historical source context, not a statement about present-day liquidity.
For stocks, share-turnover defines trading activity as period volume as a percentage of shares outstanding and is offered as a turnover-rate proxy for trading liquidity, analogous to the futures activity measures in the ranking.
Contract counts that equalize three-year dollar risk
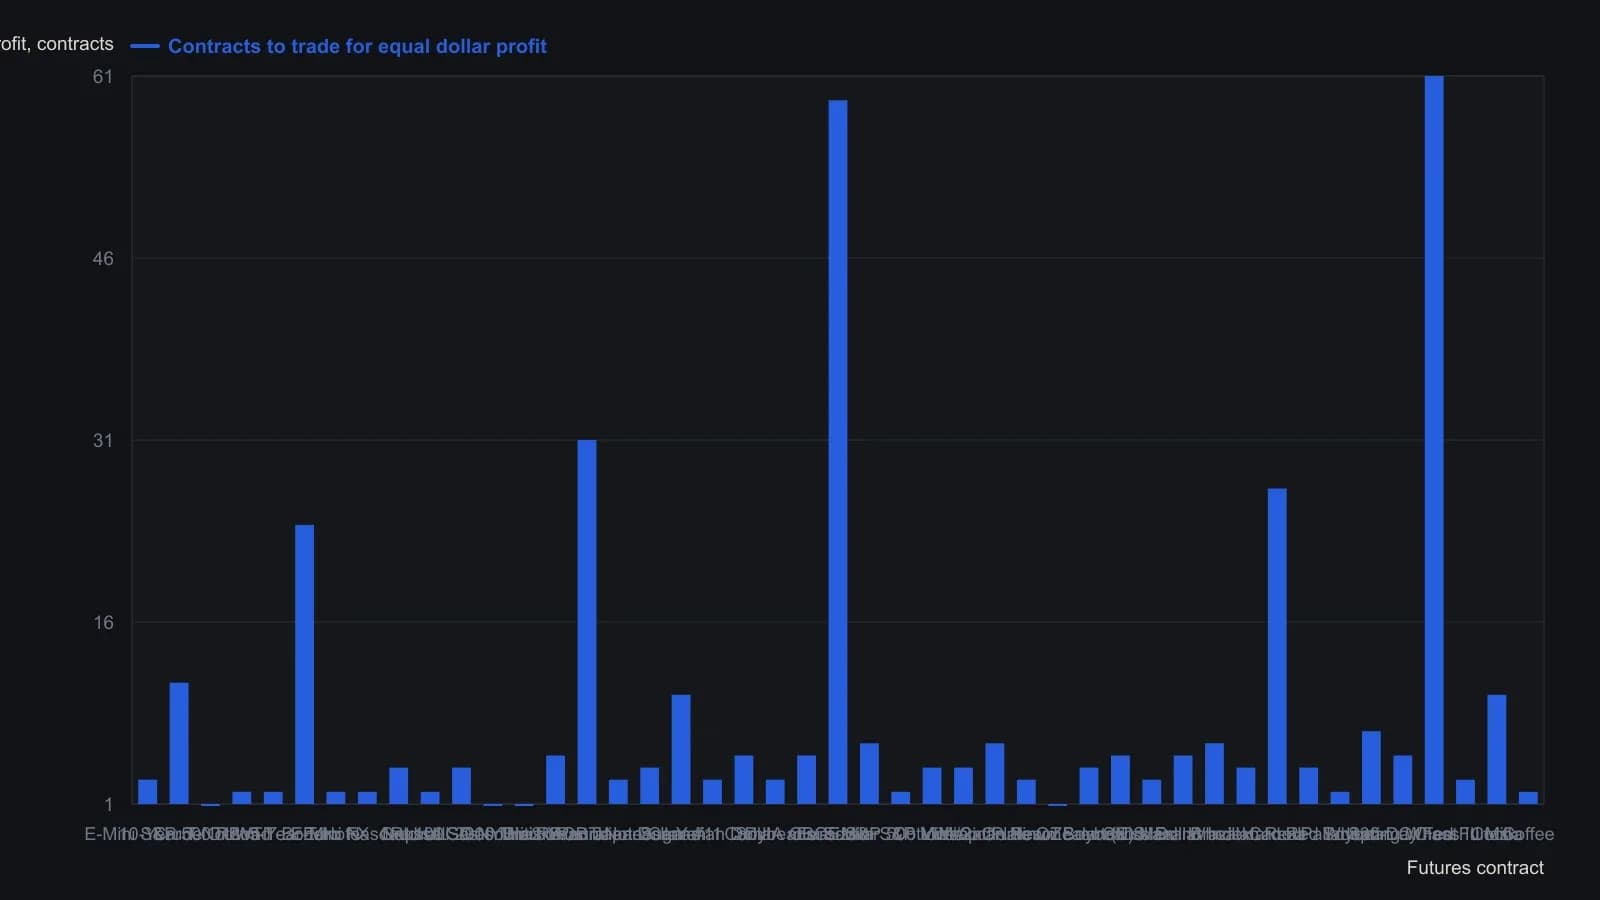
The magazine equal-weights every listed future in this column as tick dollar value times the three-year maximum price excursion. Posted margin and the relative-liquidity dots are separate columns and are not plotted here.
All readings on this track · 32 readings
- 1985Matching ticket size to negotiable commission schedules
- 1985Minimum tickets can price a small book out of its own exit
- 1992Stop-order slippage as an execution cost filter
- 1993Cost-aware walk-forward evaluation of pattern-detector signals
- 2001Audit high-turnover operating conditions as one procedure
- 2002Front-load futures commission and slippage
- 2005Inactive account fees as hidden implementation cost
- 2010A pre-trade liquidity screen for futures contracts
- 2011Currency option venues, spreads, clearing, and premium cost
- 2012Filter futures contracts by liquidity and implementation cost
- 2012Futures commission versus one tick of cost
- 2012Ranking futures liquidity for executable orders
- 2013Filter option day trades by spread, volume, and fees
- 2013Filter futures by liquidity, open interest, and effective margin
- 2014Book futures data fees as implementation cost
- 2015Use a futures liquidity rank as a pre-trade checklist
- 2015Filter unexecutable futures by liquidity, open interest, and margin
- 2015Futures liquidity ranking as an execution filter
- 2015Filtering option trades by bid-ask width
- 2016Exchange quote fees as execution costs and liquidity filters
- 2016Filter futures by liquidity, open interest, and margin cost
- 2016Comparing dollar-index futures execution costs and liquidity
- 2016A futures liquidity ranking as a screen for executable orders
- 2017Filter a futures board by liquidity, open interest, and implementation cost
- 2017Filter futures contracts by liquidity and margin cost
- 2017How residency rules raise futures implementation costs
- 2018Screen listed futures by liquidity, open interest, and margin
- 2018Contract selection is the first filter on competing bitcoin futures
- 2018Filter futures execution by liquidity and margin
- 2018Commission analysis for brokerage execution costs
- 2019Ranking futures liquidity before you size the order
- 2020Brokerage selection as an implementation-cost problem