1993issue C061-9
Cost-aware walk-forward evaluation of pattern-detector signals
A limited-connection network scores four isolated market series and trains on a five-week gain target. Editorial: treat that engine as one mechanical trading system and accept a zero-crossing entry only after smoothing lag, a one-week walk-forward step, and a commission overlay are scored together.
- A limited-connection network scores price momentum, price acceleration, volume movement, and price volatility in separate first-hidden-layer channels, then a fully connected second hidden layer combines those detections.
- Inputs and the five-week gain target are smoothed and rescaled into the range from -0.5 to +0.5 so the network is more sensitive near zero, where the buy and sell rules trigger.
- The evaluation protocol trains, forecasts the five-week gain, advances one week, and repeats, so a recorded forecast can lag the smoothed target or reverse before the later price path confirms it.
- Commission analysis charges completed long pairs a combined slippage and commission rate of 1 percent before a signal is treated as executable; short sales were omitted and no stop-loss overlay was applied.
Define the mechanical trading system
A mechanical trading system is one testable procedure that turns rule inputs, market state, and execution constraints into entry, exit, or abstention over the system holding period.
A limited-connection network scores price momentum, price acceleration, volume movement, and price volatility in separate first-hidden-layer channels, then a fully connected second hidden layer combines those detections into one output.
Price velocity is the change from the price five days earlier, and price acceleration is the five-day difference of that velocity. Each series is presented to its own input group.
The preprocessor was designed around 300 to 400 weeks of relevant history. Limited tests on series that lacked volume were used to argue that volume-movement patterns should remain in the input set.
Lock the training label and the zero band
The training label is an exponential moving average of five-week relative gain, with average price defined as the midpoint of the weekly high and low. The five-week gain target is that smoothed relative change from current average price to average price five weeks ahead.
Inputs are smoothed and then, with the training target, rescaled into the range from -0.5 to +0.5 so the network is more sensitive near zero, where the buy and sell rules trigger.
Smoothing is used to cut noisy forecasts and false action signals, but it also delays those signals. Delayed crossings can themselves be false, so input parameters are tuned against that trade-off.
Update weights without inviting paralysis
Weight updates follow Hebbian strengthening plus back-propagation of forecast-versus-target error. The stated safeguard against fitting the sample is at least four training cases for each weight.
Simulated annealing is used to start weights near a low-error region so later back-propagation needs fewer iterations and is less likely to enter network paralysis. Network paralysis is a training state in which large competing weights keep cutting in-sample error without improving later forecasts.
Walk the forecast forward, then charge the pair
The evaluation protocol trains, forecasts the five-week gain, then advances one week and repeats. The walk-forward step lets forecast and target be compared over time. The recorded forecast can lag the smoothed target and can emit a reversal before the later price path confirms it.
A rule-based entry is a signal that fires when a processed forecast or training label crosses through zero, rather than at an exact price extreme.
Completed long pairs were charged a combined slippage and commission rate of 1 percent. Short sales were omitted, and a stop-loss overlay was not applied because it would reshape the outcome histogram. Commission analysis is an evaluation filter that charges implementation cost to every completed pair before a signal is treated as executable.
Walk-forward trade profits after 1% costs
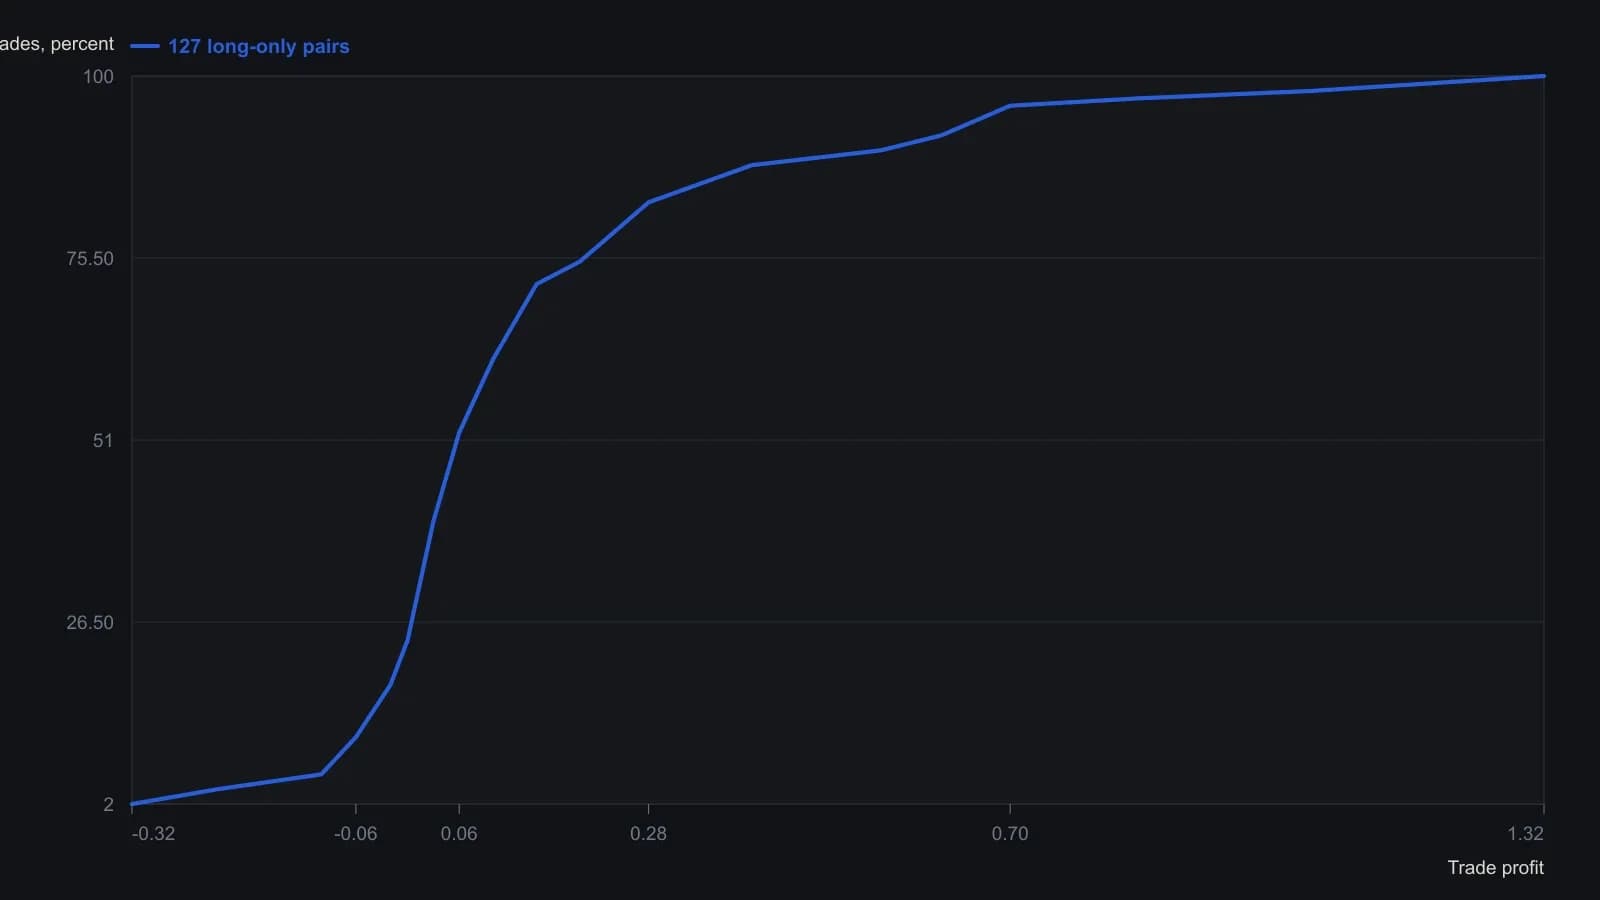
Weekly walk-forward from 9 August 1991 through 26 February 1993 after training from 4 January 1985. Short sales and stop-losses were omitted; the author notes a stop would have changed the shape of this distribution. Digitized from the plotted curve, so coordinates are approximate.
All readings on this track · 32 readings
- 1985Matching ticket size to negotiable commission schedules
- 1985Minimum tickets can price a small book out of its own exit
- 1992Stop-order slippage as an execution cost filter
- 1993Cost-aware walk-forward evaluation of pattern-detector signals
- 2001Audit high-turnover operating conditions as one procedure
- 2002Front-load futures commission and slippage
- 2005Inactive account fees as hidden implementation cost
- 2010A pre-trade liquidity screen for futures contracts
- 2011Currency option venues, spreads, clearing, and premium cost
- 2012Filter futures contracts by liquidity and implementation cost
- 2012Futures commission versus one tick of cost
- 2012Ranking futures liquidity for executable orders
- 2013Filter option day trades by spread, volume, and fees
- 2013Filter futures by liquidity, open interest, and effective margin
- 2014Book futures data fees as implementation cost
- 2015Use a futures liquidity rank as a pre-trade checklist
- 2015Filter unexecutable futures by liquidity, open interest, and margin
- 2015Futures liquidity ranking as an execution filter
- 2015Filtering option trades by bid-ask width
- 2016Exchange quote fees as execution costs and liquidity filters
- 2016Filter futures by liquidity, open interest, and margin cost
- 2016Comparing dollar-index futures execution costs and liquidity
- 2016A futures liquidity ranking as a screen for executable orders
- 2017Filter a futures board by liquidity, open interest, and implementation cost
- 2017Filter futures contracts by liquidity and margin cost
- 2017How residency rules raise futures implementation costs
- 2018Screen listed futures by liquidity, open interest, and margin
- 2018Contract selection is the first filter on competing bitcoin futures
- 2018Filter futures execution by liquidity and margin
- 2018Commission analysis for brokerage execution costs
- 2019Ranking futures liquidity before you size the order
- 2020Brokerage selection as an implementation-cost problem