2017issue C0358
Filter a futures board by liquidity, open interest, and implementation cost
A 2017 futures listing ranked contracts by value, a three-year price range, open interest, and a volume factor, then compared posted margin with effective margin. Editorial reading: treat that board as an execution menu so only markets with real activity, absorbable inventory, and a comparable implementation-cost rate remain.
- A liquidity filter ranks listed futures by multiplying contract point value by a three-year maximum price move, then by open interest, then by a volume factor usually from one to four.
- Relative activity can be shown as a descending mark count so markets with the densest marks sit above markets that show one mark or none.
- Open interest becomes comparable when it is scaled by an equal-dollar-profit contract count that puts each market on the same dollar unit.
- Effective percent margin divides posted margin dollars by the three-year dollar price range, then multiplies by one hundred, so posted margin can be compared with capital locked per unit of historical range.
Read the board as an execution menu
Editorial reading: treat a futures board as an execution menu. First apply a liquidity filter so only markets with real activity remain. Then read open interest as the inventory that can absorb the order. Finally convert posted margin into a comparable implementation-cost rate before choosing which contract is tradable.
The archive facts describe a historical ranking workflow. The three-step menu order is a TradersWeek interpretation and is not archive language.
Rank listed futures by activity
A futures liquidity ranking can be built by multiplying contract point value by a three-year maximum price move, then by open interest, then by a volume factor usually from one to four.
Relative contract liquidity multiplies that equal-dollar-profit contract count by total open interest and by a volume factor. The volume factor is the greater of one and the exponential of natural-log volume divided by natural-log 5000, minus two. That scalar usually sits between one and four and adjusts the liquidity score for unusually thin or unusually heavy volume.
Relative activity can be shown as a descending mark count so markets with the densest marks sit above markets that show one mark or none. In this workflow, the liquidity filter is that ranking: it screens listed futures by how readily size can be transacted, using activity marks built from contract value, a multi-year price range, open interest, and a volume scalar.
Scale open interest to a common dollar unit
An equal-dollar-profit contract count multiplies tick dollar value by the three-year maximum price excursion so each listed count represents the same dollar unit. It is the number of contracts of one market needed to match the same three-year dollar range as another market.
Open interest analysis uses outstanding contract inventory, scaled by that equal-dollar-profit contract count, as a measure of how much paper the market can absorb.
Compare posted margin with effective margin
Effective percent margin equals posted margin dollars divided by the three-year dollar price range of the contract, then multiplied by one hundred. Commission analysis compares posted percent margin with effective percent margin so capital locked per unit of historical dollar range is visible before an order is chosen.
In the 2017 listing, posted percent margin ran from 0.1 on short-rate futures to above 8 on some agricultural and currency contracts, while gold showed an effective percent margin of 33.9 against a posted 5.5.
A share-turnover counterpart in stocks
For stocks, period volume as a percentage of shares outstanding can be treated as a turnover-rate proxy for trading liquidity. Share turnover is equity volume over a period divided by shares outstanding.
Posted versus effective margin on the March 2017 futures board
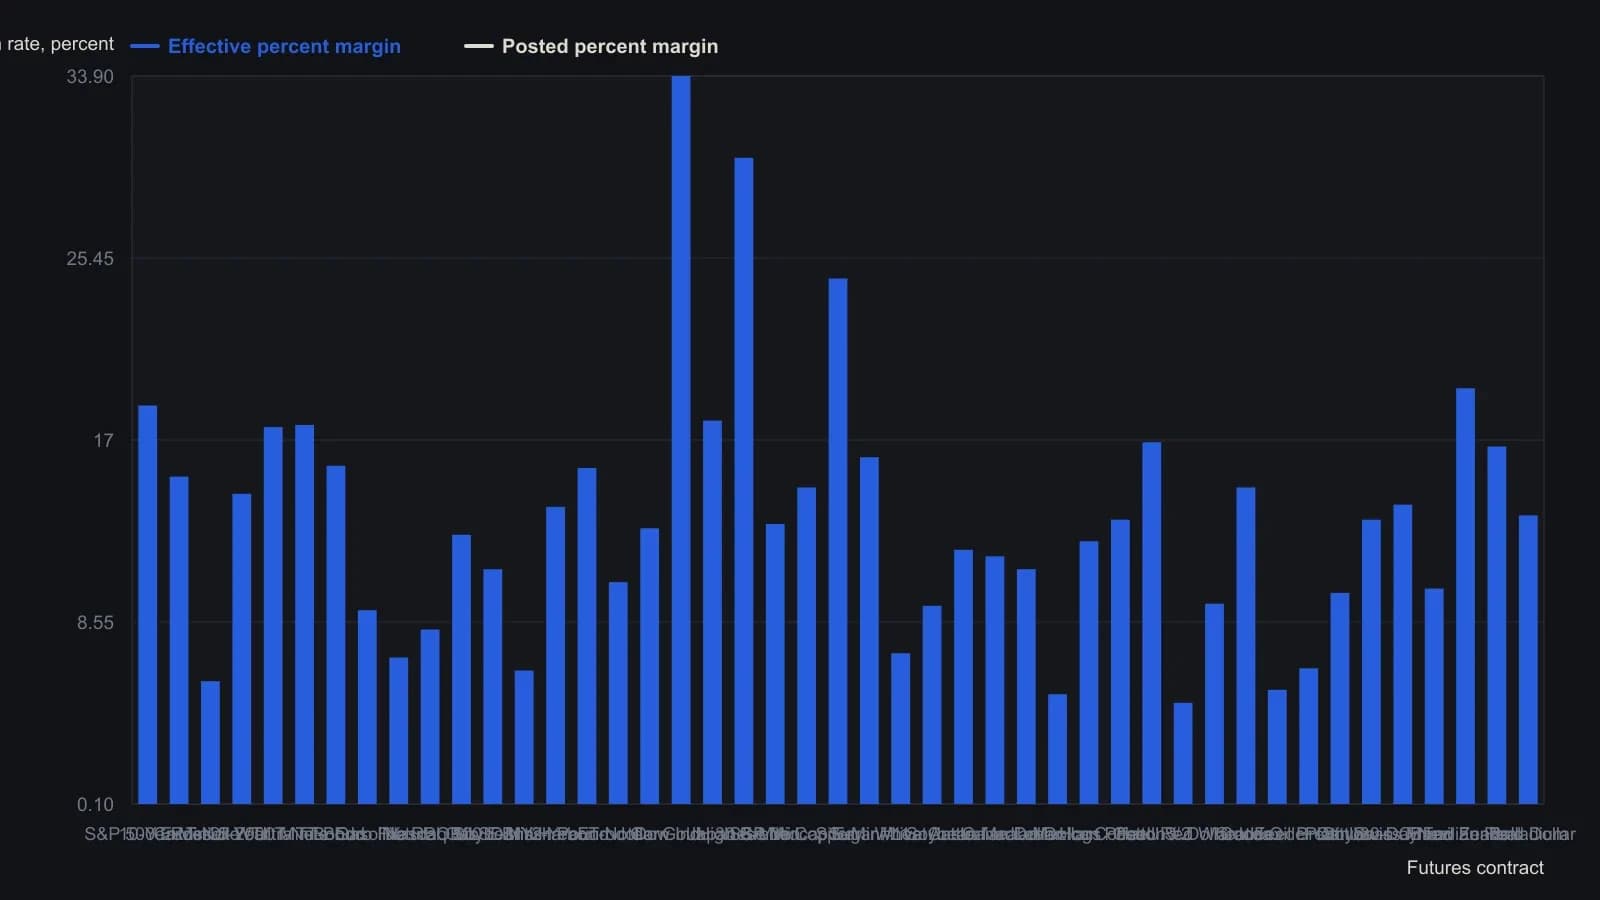
Effective percent margin is posted margin dollars divided by the contract’s three-year dollar price range, times 100. Contracts stay in the source’s relative-liquidity order. Most listings are the March 2017 expiry; Eurodollar is December 2017 and a few livestock, metals, and rates use February or April.
All readings on this track · 32 readings
- 1985Matching ticket size to negotiable commission schedules
- 1985Minimum tickets can price a small book out of its own exit
- 1992Stop-order slippage as an execution cost filter
- 1993Cost-aware walk-forward evaluation of pattern-detector signals
- 2001Audit high-turnover operating conditions as one procedure
- 2002Front-load futures commission and slippage
- 2005Inactive account fees as hidden implementation cost
- 2010A pre-trade liquidity screen for futures contracts
- 2011Currency option venues, spreads, clearing, and premium cost
- 2012Filter futures contracts by liquidity and implementation cost
- 2012Futures commission versus one tick of cost
- 2012Ranking futures liquidity for executable orders
- 2013Filter option day trades by spread, volume, and fees
- 2013Filter futures by liquidity, open interest, and effective margin
- 2014Book futures data fees as implementation cost
- 2015Use a futures liquidity rank as a pre-trade checklist
- 2015Filter unexecutable futures by liquidity, open interest, and margin
- 2015Futures liquidity ranking as an execution filter
- 2015Filtering option trades by bid-ask width
- 2016Exchange quote fees as execution costs and liquidity filters
- 2016Filter futures by liquidity, open interest, and margin cost
- 2016Comparing dollar-index futures execution costs and liquidity
- 2016A futures liquidity ranking as a screen for executable orders
- 2017Filter a futures board by liquidity, open interest, and implementation cost
- 2017Filter futures contracts by liquidity and margin cost
- 2017How residency rules raise futures implementation costs
- 2018Screen listed futures by liquidity, open interest, and margin
- 2018Contract selection is the first filter on competing bitcoin futures
- 2018Filter futures execution by liquidity and margin
- 2018Commission analysis for brokerage execution costs
- 2019Ranking futures liquidity before you size the order
- 2020Brokerage selection as an implementation-cost problem