1998issue C071-6
Secure f keeps Optimal f sizing inside a Drawdown limit
Optimal f sizing searches a past trade sequence for the equity fraction that would have maximized compounded terminal wealth, but it ignores trade order and does not constrain drawdown. Secure f keeps that objective and adds a Drawdown limit, which in the source illustration moved a one-third peak down to just over 20% of capital.
- Optimal f sizing searches a past trade sequence for the equity fraction that would have maximized compounded terminal wealth.
- Because Optimal f sizing ignores trade order, it does not constrain equity drawdown while it maximizes terminal wealth.
- Secure f keeps the same terminal-wealth objective and adds an explicit Drawdown limit, so the chosen fraction can be conservative or aggressive depending on the bound.
- Neither Optimal f sizing nor secure f can convert an unprofitable trade history into a profitable one.
Size the bound before the fraction
Editorial note: TradersWeek treats position size as a constrained optimization problem. First choose the largest loss the account can absorb, then find the largest equity fraction that still stays inside that bound.
The archive workflow begins with Optimal f sizing. It searches a past trade sequence for the equity fraction that would have maximized compounded terminal wealth.
What Optimal f sizing searches
In a two-outcome setting the source Kelly-style formula can recover a one-third fraction from two equal winners and one equal loser.
A worked coin-toss series with equal $500 wins and losses also peaks terminal wealth at a one-third fraction, implying $33,333 of a $100,000 account on the first trade.
Terminal wealth is not a drawdown bound
Optimal f sizing ignores trade order and therefore does not constrain equity drawdown while it maximizes terminal wealth.
Neither Optimal f sizing nor secure f can convert an unprofitable trade history into a profitable one.
How a Drawdown limit changes the fraction
Secure f keeps the same terminal-wealth objective but adds an explicit maximum-drawdown limit, so the chosen fraction can be conservative or aggressive depending on the trader's bound.
In the source illustration, a $5,000 drawdown cap moved the peak fraction from 33.3% down to just over 20% of capital.
Maximum drawdown versus the equity fraction f
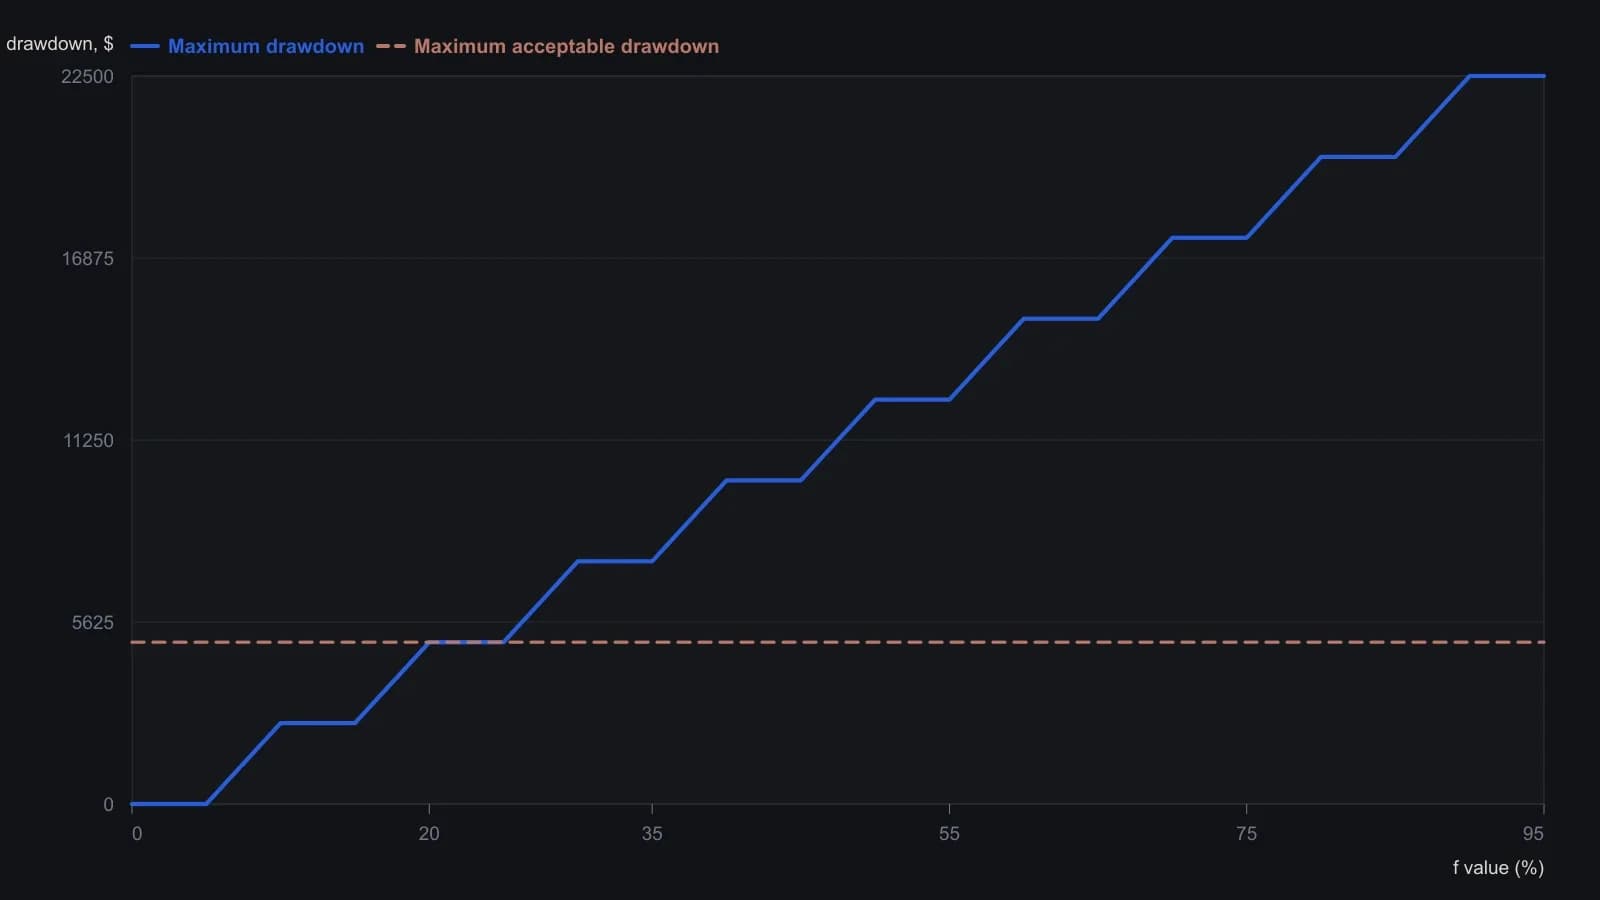
The table is the three-series coin-toss futures illustration with $100,000 starting capital, $10,000 per contract and $500 per one-point move. In the same table TWR peaks at 118.52 ($000) at f = 33%.
Contracts, an unsized baseline, and Fixed contract sizing
On a 1985-97 German mark breakout example, unconstrained Optimal f sizing reached as many as 75 contracts in one trade, while drawdown-capped secure f stayed at a maximum of four.
In that same comparison, both methods raised net profit and maximum drawdown versus an unsized baseline, but secure f produced a net-profit-to-maximum-drawdown ratio more than seven times that of Optimal f sizing.
Editorial note: Read the unsized baseline as the Fixed contract sizing contrast in this archive comparison. Optimal f sizing and secure f change the contract count with the chosen fraction. The baseline does not.
All readings on this track · 12 readings
- 1990Constructing optimal f when trade sizes differ
- 1993Portfolio heat, optimal f, and drawdown limits
- 1994Construct historical-optimum-leverage from one equity-path
- 1995Optimal f as a leverage bound for commodity account growth
- 1998Secure f keeps Optimal f sizing inside a Drawdown limit
- 1998Optimal f contract counts versus equity fractions
- 1999Match futures starting capital to system risk
- 1999Search system inputs together with Optimal f sizing
- 2001Bounded crash risk with capital units and optimal f
- 2002Optimal f sizing and risk of ruin as exposure filters
- 2003Cap ruin and drawdown before optimal-f
- 2006Ruin odds, the Kelly fraction and optimal f as size filters