2007issue C111-4
Name the sideways regime before you test the breakout
Trading-range and base-building can look equally flat and still need different breakout tests and money-flow readings. Width, gap behavior, and market-condition decide which toolkit belongs on the chart.
- Flat price is not one regime. Trading-range, platform-building, bottoming, and consolidating modes need different indicator choices even when the path looks similar.
- A wide trading-range is a divided-conviction stalemate that can break either way with velocity. Narrower base-building is typically wait-and-see accumulation that continues the longer-term trend to the upside.
- Trading-range exits seldom persist as gaps, while a completed platform often leaves through a breakaway or measuring gap.
- Money Flow Index belongs on a multi-platform advance as a value-oriented continuation reading, not as a generic oscillator for every flat chart.
Start with the market-condition
Sideways markets are not a single condition. Trading-range, platform-building, bottoming, and consolidating modes require different indicator choices even when the price path looks similarly flat.
Base-building is a compact sideways pause in which large-lot accumulation typically precedes an upside continuation rather than a two-way stalemate. A trading-range is a wide, indecisive sideways regime that can resolve in either direction and is poorly served by trend-following tools. Editorial reading: name that market-condition before you test the breakout or apply Money Flow Index.
Width and resolution are not interchangeable
A trading-range regime is typically a long- to intermediate-term stalemate of divided conviction, often more than 10 points wide, and can break either way with velocity.
Platform or base-building sideways action is usually narrower than a trading-range, often a wait-and-see accumulation phase, and typically breaks out to the upside as a continuation of the longer-term trend. A narrower sideways band, often under five points, should not be treated as a small trading-range because it frequently belongs to a different market-condition.
Breakout character follows the prior regime
A breakout is the first decisive exit from a sideways structure. It is read as more reliable when the prior regime and gap or volume behavior match the expected direction.
Trading-range breakouts seldom appear as lasting gap events. Any gap is more likely a common gap that fills quickly. A completed platform frequently exits with a breakaway or measuring gap.
Match tools to the regime
In a trading-range, price oscillators, cycle tools, volume bars or oscillators, momentum, money flow, and other hybrid price-volume formulas are more appropriate than on-balance volume lines, moving averages, accumulation-distribution, or flow-of-funds trend tools.
In a platform or base-building regime, quality, flow-of-funds, and accumulation-distribution readings matter more. RSI can show improvement before the base completes, while moving averages, overbought-oversold oscillators, and volatility tools are weaker fits.
Money Flow Index is not a generic flat-chart tool
Money Flow Index is a hybrid price-and-volume oscillator used to detect improving or deteriorating participation while a sideways structure is still unresolved. On a multi-platform advance it is used to read value-oriented, earnings-driven continuation rather than as a generic sideways oscillator.
C21 daily close: choppy high then a grinding breakdown
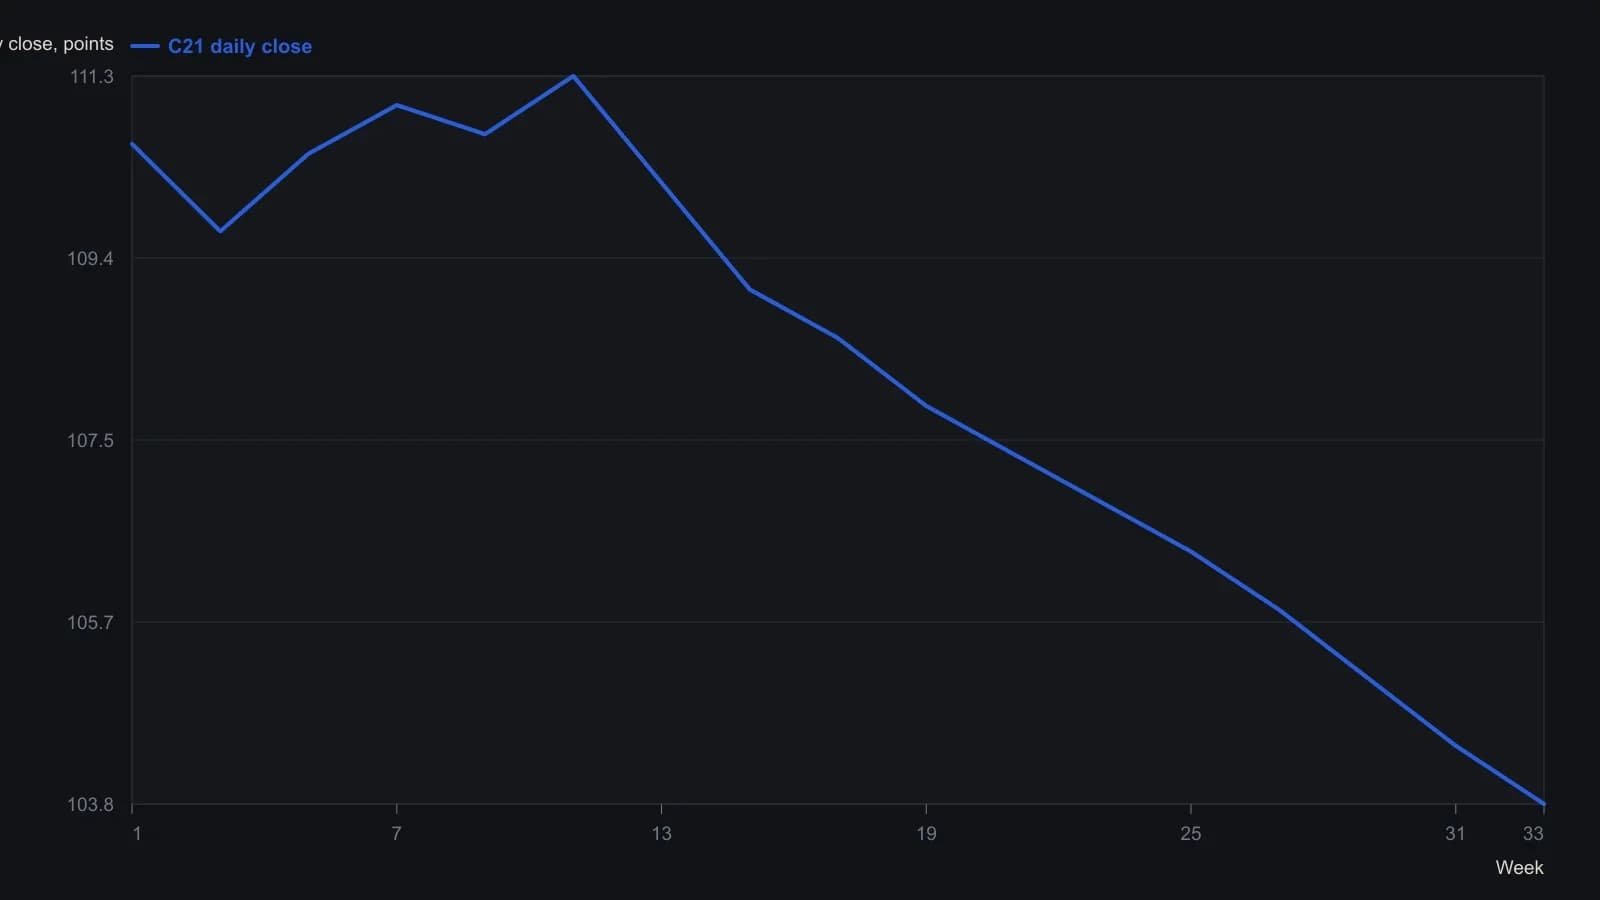
Only the final 103.80 print is exact. Earlier closes are digitized from the raster to about 0.2 points on a 1.00 price grid.
All readings on this track · 17 readings
- 1994Cup-and-handle base construction and volume breakout
- 1996Constructing a mobility oscillator from price distributions
- 1996Float turnover as a construction rule for bases and breakouts
- 2001A historically derived growth checklist for entry, exit, and staying out
- 2003Base-building then breakout after a market bottom
- 2005Commodity group bases, breakouts and pennants
- 2005Logic-first construction of a base-break system
- 2005Quiet bases copied onto an intradacy clock
- 2005Failed cup-with-handle after earnings and float filters
- 2006Turning flat bases into breakout system rules
- 2007Base-building holds versus swing timing
- 2007Confirmed index highs, style-fit trend systems, and bases
- 2007Name the sideways regime before you test the breakout
- 2011A three-peaks-and-a-domed-house chart is not a complete timing model
- 2014Constructing a volume-capacity channel from a sideways base
- 2016Waves, bases, and the campaign log on a price chart
- 2020Ratio charts as regime context for relative strength and yield spreads