1988issue C021-6
Constructing tick-weighted money flow and price divergences
Daily close sign, daily price-change weight, tick-level price times size, a large-print filter, and the accumulation window are separate construction choices. Each one changes the cumulative path that is later read against price.
- Daily on-balance volume adds or subtracts a full session's volume from the sign of the close, so a 1% day and a 2% day receive the same volume weight.
- Tick-level money flow is the running sum of price times volume on upticks minus price times volume on downticks, computed from every print rather than from a single daily close.
- The same overlay is read as confirmation when price and cumulative money flow share similar slope, and as divergence when those slopes conflict.
- A non-block filter that drops prints larger than 10,000 shares, a change in the accumulation window, or a shift from a single name to a basket or composite can change the picture.
On-balance volume, price-weighted volume, and tick-level money flow accumulate signed volume in different ways. Non-block money flow and the accumulation window are further construction choices.
Daily close sign and price-weighted volume
Daily on-balance volume is a cumulative volume ledger that adds session volume on up closes and subtracts it on down closes. Because the full session's volume takes the sign of the close, a 1% day and a 2% day receive the same volume weight.
A price-weighted volume ledger multiplies each session's volume by that day's price change before the signed accumulation. Larger moves therefore receive more influence than in the unweighted ledger.
Tick-level money flow
Tick-level money flow is a cumulative, trade-by-trade series. It adds price times size on upticks and subtracts price times size on downticks, computed from every print rather than from a single daily close.
Last price can be unchanged while cumulative money flow falls if larger downtick size outweighs smaller uptick size in the tape sample.
Confirmation and divergence
The same overlay is read as confirmation when price and cumulative money flow share similar slope over the same window. It is read as divergence when those slopes conflict. Divergence is a plotted split in direction or slope between price and the cumulative money-flow series.
Name, basket, and composite
The same money-flow construction can be run on a single name, an industry basket, or an exchange composite. Those pictures need not agree.
Large-print filters and the accumulation window
Non-block money flow excludes prints larger than 10,000 shares. The illustrated series drops every trade larger than 10,000 shares, and the construction note is to inspect both filtered and unfiltered totals before judging a plot.
The construction notes treat the series as least reliable on illiquid names and on issues priced below $20 because a single large print can warp the cumulative path.
Because the indicator is a cumulative sum, changing the accumulation window changes the picture, so more than one time span is part of the review.
Ford closing price versus non-block money flow
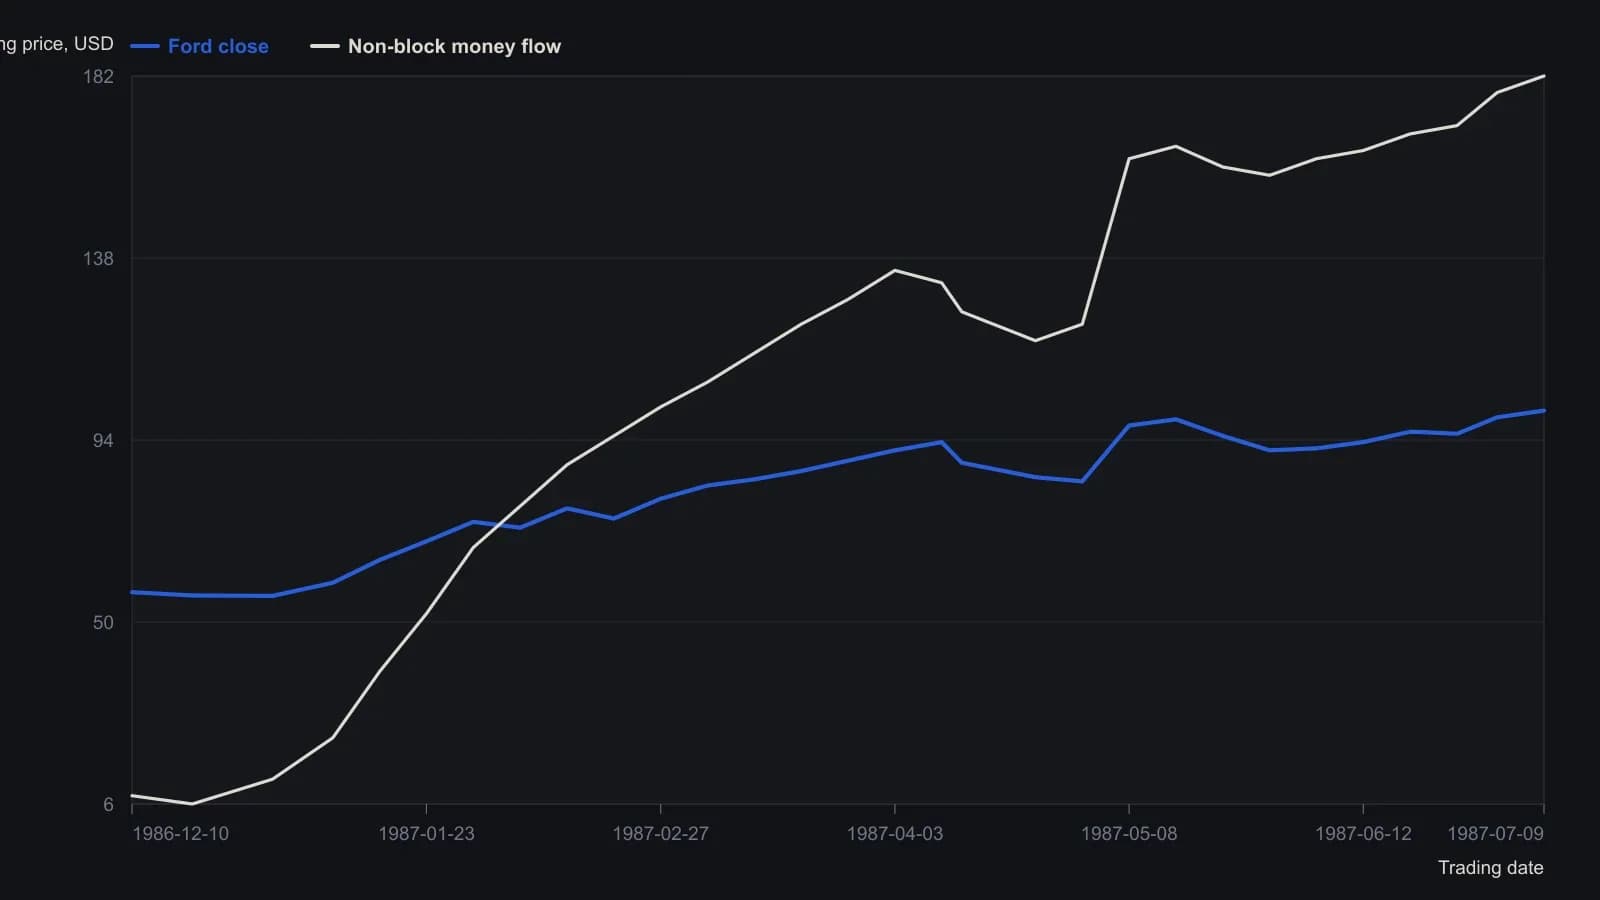
The source filtered out prints larger than 10,000 shares. Left axis is dollars; right axis is cumulative money flow in millions of dollars. Digitized from the raster, so levels are approximate.
All readings on this track · 13 readings
- 1988Constructing tick-weighted money flow and price divergences
- 1989Four-state money-flow-index as permission for a next-bar breakout-system
- 1989Constructing a suggest-then-confirm Money Flow Index
- 1993Five-rung money flow from signed print volume
- 1993Physics analogies for building cycle and money flow indicators
- 1994Keep a wave count as a draft until money flow and a trendline agree
- 1999Take the rectangular-base breakout from money-flow confirmation, not from a late strength average
- 2004Constructing a volume-flow rule from money flow
- 2006Classify the regime before the bar read
- 2015Constructing a bounded money-flow oscillator from range and volume
- 2016Combining RSI, moving averages, and money flow
- 2018Five-rule technical rating as a rotation filter
- 2020Combining money-flow, RSI, and breadth for dynamic pressure zones