2011issue C1116-23
A three-peaks-and-a-domed-house chart is not a complete timing model
The same topping geometry can produce a premature high unless base-building, a standard-count, a long-term-interval check, and a possible sideways-movement after the appointed high are treated as separate, checkable stages.
- The three-peaks-and-a-domed-house geometry is a multi-stage tool for locating and timing cyclical and secular bull-market highs, not only a picture of three peaks.
- A standard-count cannot start until base-building is complete, and a symmetrical reading starts that count from the second test of the low.
- A long-term-interval from a July 23, 1996 origin pointed to July or September 2011 and treated the april-target as too early.
- If an advance finishes on time but the next decline is delayed, the intervening action is a sideways-movement: a sharp break, a recovery near the old high, and roughly flat net progress.
A picture of three peaks is not the whole tool
The three-peaks-and-a-domed-house geometry is presented as a tool for locating and timing cyclical and secular bull-market highs, not only as a standalone picture of three peaks. The span from the first peak to the third is specified as typically eight months, never shorter than six months and never longer than 10 months.
After the third peak, the formation requires a separating-decline. That drop is a three-wave down-up-down move that finishes below one or both of the retracements that followed the first two peaks. TradersWeek editorial reading: a chart that only shows three peaks has not yet completed the timing sequence.
Wave-counting locates the later origin
Wave-counting labels the down-up-down structure of the separating-decline so the origin of later counts can be located. In the 2010 case, wave 1 of that decline can be read as ending on the May 6 flash crash, with a bounce into May 12 and a final drop into May 25, June 8, or possibly July 2.
Base-building comes before the first-floor-wall
Before the first-floor-wall advance, a base of two tests of the low must form. That base-building step is required before the next sustained advance can be counted as underway. If the base is treated as symmetrical, the count starts from the second test.
The standard-count can still be early
The standard-count from the origin of the next advance to the bull-market high is seven months and 10 days, or 221 to 224 days. Counting 221 to 224 days from an August 26, 2010 second test produced an april-target of April 4-7, 2011. Other interval work later treated that window as too early.
A long-term-interval is a separate check
A long-term-interval search begins with a 15-year, two-month rule of thumb and can span from 15 years to 15 years 11 months. From a July 23, 1996 origin that search points to July or September 2011 rather than April.
TradersWeek editorial reading: pattern-recognition in this workflow means comparing an explicit count or interval against later price action, rather than treating the geometry as a standalone forecast. The april-target was consistent with the standard-count and still too early once the longer window was applied.
A delayed decline is a sideways-movement
When an advance finishes at the appointed time but the next decline is delayed, the intervening action is classified as a sideways-movement. That stage is a sharp break, a recovery near the old high, and roughly flat net progress while the market regroups.
TradersWeek editorial reading: the required base, the longer interval, and any pause after the appointed high are separate, checkable stages. The same chart can produce a premature target if those stages are collapsed into the first recognizable picture of three peaks.
Dow industrials from the 2007 high through the 2008–09 lows and the next advance
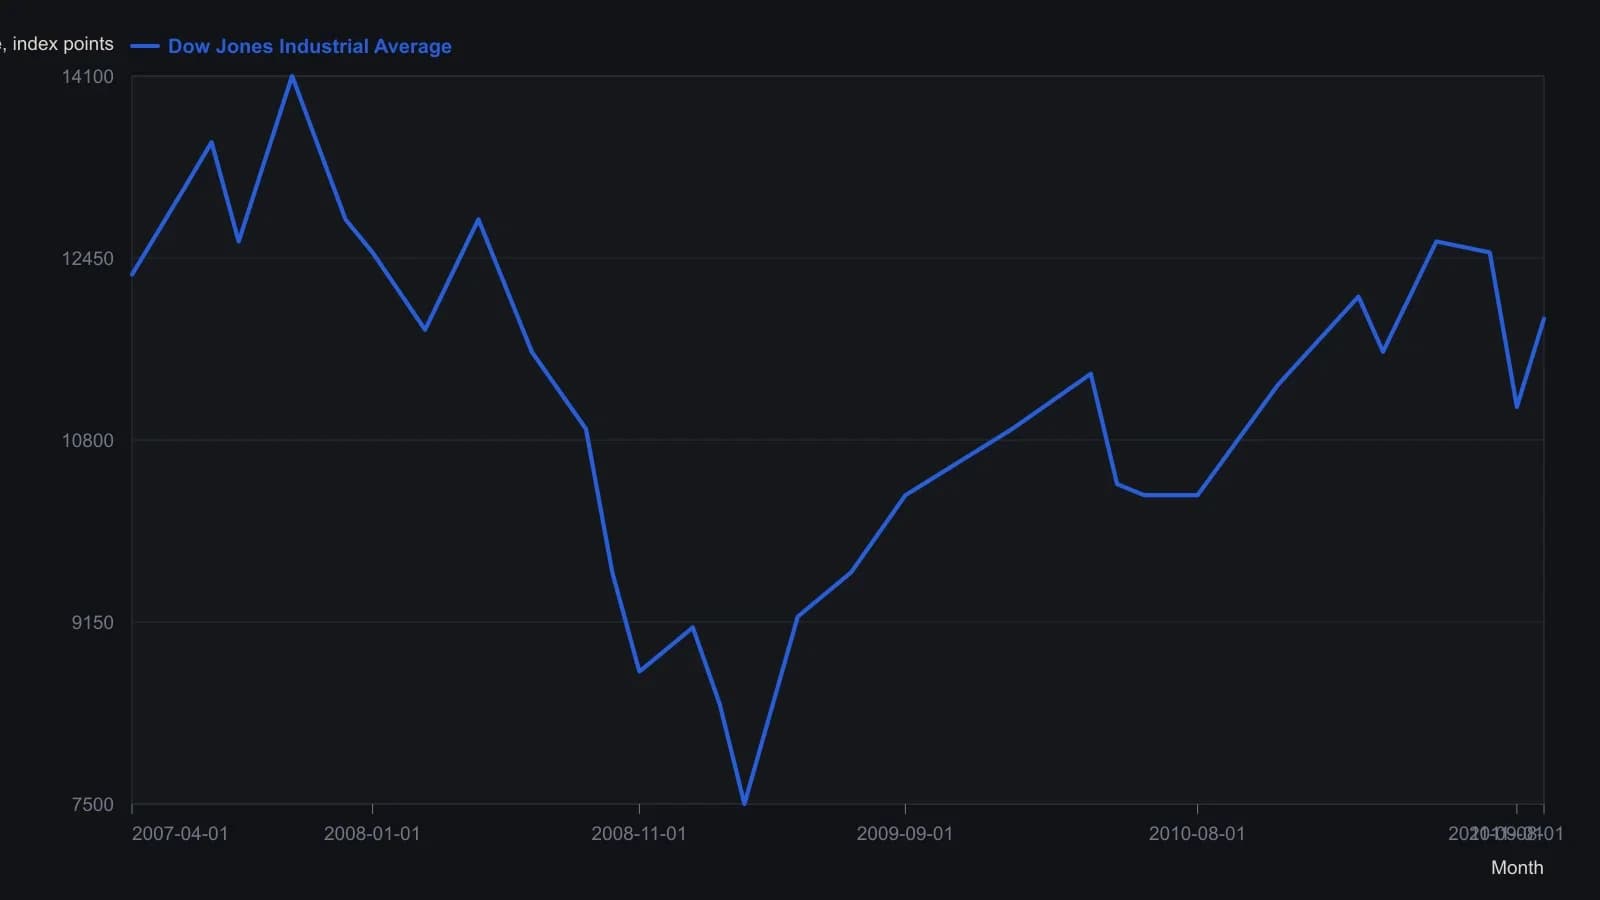
Approximate readings from a cropped raster with axis numerals stripped; y-values rounded to 100 points. The November 2008 low is the stated origin for the following basic advance; the still-lower 2009 print ends the bear market and is not used as that origin.
All readings on this track · 17 readings
- 1994Cup-and-handle base construction and volume breakout
- 1996Constructing a mobility oscillator from price distributions
- 1996Float turnover as a construction rule for bases and breakouts
- 2001A historically derived growth checklist for entry, exit, and staying out
- 2003Base-building then breakout after a market bottom
- 2005Commodity group bases, breakouts and pennants
- 2005Logic-first construction of a base-break system
- 2005Quiet bases copied onto an intradacy clock
- 2005Failed cup-with-handle after earnings and float filters
- 2006Turning flat bases into breakout system rules
- 2007Base-building holds versus swing timing
- 2007Confirmed index highs, style-fit trend systems, and bases
- 2007Name the sideways regime before you test the breakout
- 2011A three-peaks-and-a-domed-house chart is not a complete timing model
- 2014Constructing a volume-capacity channel from a sideways base
- 2016Waves, bases, and the campaign log on a price chart
- 2020Ratio charts as regime context for relative strength and yield spreads