2005issue C111-4
Failed cup-with-handle after earnings and float filters
After a fundamental overlay flags accelerating earnings and sector leadership, the chart still has to complete. This archive case uses base-building and volume-price analysis to treat a quiet handle, missing news, and an oversized share count as reasons to stand aside.
- The walk-through mixed fundamental and technical filters in roughly equal parts and began with leadership names in a strong sector rather than a random ticker.
- Current-quarterly-earnings and annual-earnings-consistency can clear a name, as they did when PetroChina's quarterly rise and five-year growth were treated as passing the stated annual line, without making the chart pattern live.
- A cup-with-handle after a new high still needs contracting volume, then a breakout with fresh company news and heavy volume. A quiet handle with no announcements is a breakout-failure.
- Share-count-preference can set the same name aside when shares outstanding sit far above the smaller float described as easier to move, and screens using similar filters can still disagree because of choices such as time frame.
Start with the sector, not a random ticker
The method in this walk-through mixes fundamental and technical filters in roughly equal parts. It is described as requiring chart reading, company financials, and awareness of overall market direction.
The search did not start from a random ticker. It began by scanning leadership names in a strong sector. That sector-leadership step is the first cut: prefer names that lead the group rather than those that lag it.
Earnings can clear while the pattern stays unfinished
Current-quarterly-earnings are defined as after-tax profits divided by common shares outstanding. That figure is the first fundamental filter.
The annual-earnings-consistency rule cited next asks for a year-over-year increase in each of the prior five years, a growth rate of at least 15 percent a year with a cited target above 50 percent, and growth that is not concentrated in a single year. A high price-to-earnings ratio is treated as unimportant to the rule itself.
In the walk-through, PetroChina showed a 78 percent rise in quarterly earnings and a 17 percent increase over five years. The author treated that annual figure as clearing the 15 percent line. Fundamental-overlay, in the sense used here, is that earnings stack plus industry leadership, later joined by share-count size, laid over the chart so a tidy-looking base can still be rejected.
Quarterly earnings growth in major integrated oil and gas
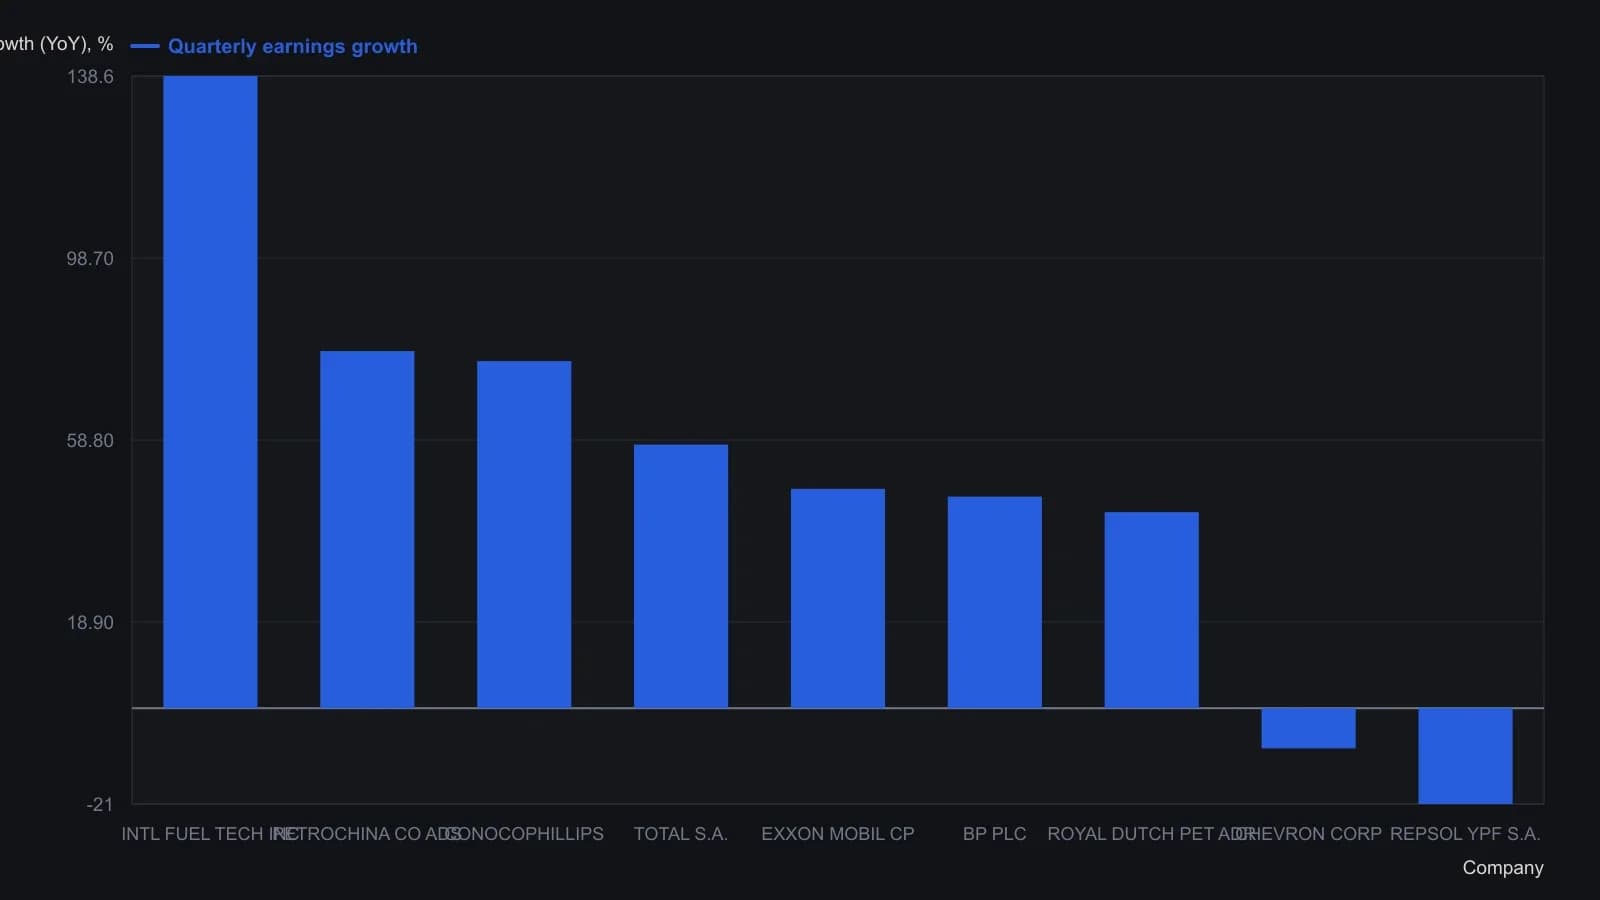
International Fuel Tech printed first at 138.60 percent but was skipped because it did not trade on a large exchange. The matching laggards list is the same names inverted, which the source reads as a small peer group.
The cup-with-handle that never broke
The intended entry pattern is a cup-with-handle after a new high. The shape is often compared with an ascending triangle. Base-building here means a post-high consolidation that carves a rounded cup and a shorter handle, treated as a repeatable chart condition that must complete before an entry hypothesis is live.
A cup-with-handle prints a new high, a deeper pullback, a return toward that high, and a shallower pullback before any attempt to break out. Contracting volume through the consolidation is part of the volume-price-analysis read. The preferred breakout coincides with fresh company news and heavy volume. The 50-day and 200-day moving averages are also used as support.
On the illustrated PetroChina chart, a 52-week high of 95.65 printed on August 9. A gapped cup and handle then formed on descending volume. No breakout developed, and no new company announcements appeared. Volume-price-analysis reads whether volume contracts through the base and then expands on a push to new prices. A quiet handle with no follow-through is treated as a failed signal. That is the breakout-failure in this case: a completed-looking base that never pushes through to new prices, especially when fresh company news and volume expansion are absent.
Share count and a screen that would not recreate the list
The same name was set aside as too large. It carried a 16.5 billion market capitalization, above a 5 billion large-cap cutoff, and 172.85 million shares outstanding. Share-count-preference here is a bias toward fewer shares outstanding on the view that a smaller float is easier to move than a very large one. The stated preference is for nearer 10 million shares rather than 100 million.
A generic web screener loaded with many of the same filters returned no names. A published pick list could not be recreated, which the author attributed to subjectivity such as time frame. Another oil-and-gas growth leader, ConocoPhillips, did appear on that list.
Editorial note: the archive facts describe a historical workflow in which earnings quality, pattern completion, volume follow-through, and float size can each veto the others. TradersWeek presents that sequence as a lesson in standing aside, not as a claim that the filters predict future results.
All readings on this track · 17 readings
- 1994Cup-and-handle base construction and volume breakout
- 1996Constructing a mobility oscillator from price distributions
- 1996Float turnover as a construction rule for bases and breakouts
- 2001A historically derived growth checklist for entry, exit, and staying out
- 2003Base-building then breakout after a market bottom
- 2005Commodity group bases, breakouts and pennants
- 2005Logic-first construction of a base-break system
- 2005Quiet bases copied onto an intradacy clock
- 2005Failed cup-with-handle after earnings and float filters
- 2006Turning flat bases into breakout system rules
- 2007Base-building holds versus swing timing
- 2007Confirmed index highs, style-fit trend systems, and bases
- 2007Name the sideways regime before you test the breakout
- 2011A three-peaks-and-a-domed-house chart is not a complete timing model
- 2014Constructing a volume-capacity channel from a sideways base
- 2016Waves, bases, and the campaign log on a price chart
- 2020Ratio charts as regime context for relative strength and yield spreads