1996issue C021-8
Constructing a mobility oscillator from price distributions
A lookback histogram can be turned into a signed mobility oscillator that treats sparse bins as freer travel and dense bins as congestion. The same high-low window as a stochastic oscillator supplies a directional check, and an options straddle can sit beside a break that has no specified side.
- Congestion is a lookback region where price spends disproportionate time, and a longer or more recent stay is treated as more significant.
- The price-distribution function is a tabular histogram from the lookback minimum low to the maximum high, split into equal bins that share the stochastic oscillator high-low window.
- The mobility oscillator equals 100 times one minus the current-bin frequency over the modal-bin frequency, signed by whether the close is above or below the price-mode, and is bounded from -100 to +100.
- Near-zero values mark congestion; a stochastic oscillator can assign direction, and an options straddle can overlay a break whose side is not specified.
Congestion and a data-shaped histogram
Congestion is a lookback region where price spends disproportionate time. A longer stay or a more recent stay is treated as more significant, and the resulting distribution peak is later treated as a reference zone.
The working hypothesis is that prices move more freely where the distribution is small and more slowly where the distribution is large.
Unlike a lognormal options-pricing assumption, these distributions are tabular histograms. Their shape is taken from the data rather than from a fixed functional form.
Build the lookback price-distribution function
A lookback price-distribution function is built from the period minimum low to the maximum high and split into equal intervals. It uses the same high-low window as a stochastic oscillator.
That function is the empirical frequency of price action across those equal bins. No parametric shape is assumed.
Recover bin frequencies from the cumulative function
Bin frequencies equal adjacent differences of a cumulative price-distribution function that treats each bar as uniformly distributed between its high and low.
The cumulative price-distribution function is the running fraction of lookback price action at or below each bin boundary. Adjacent differences of that cumulative record recover the binned frequencies.
OEX 14-day price-distribution function
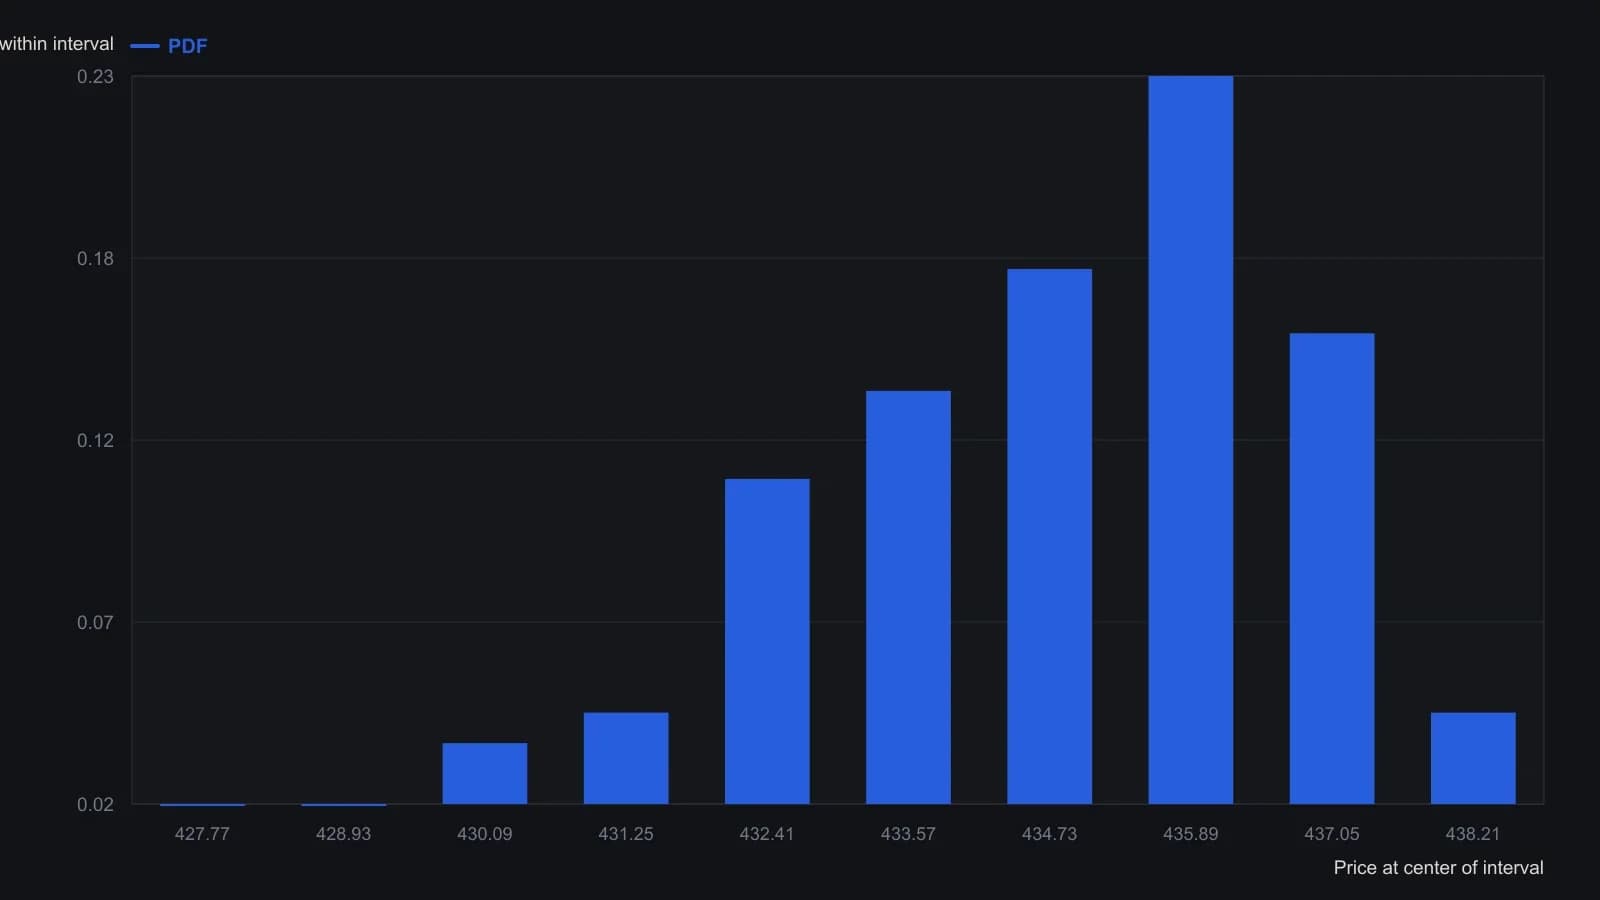
Lookback N=14, M=10 equal intervals from the 427.19 low to the 438.79 high. Interval 8 is the mode (PDFmax=0.232). The last close is in interval 10 (PDFC=0.044).
Turn the bins into a signed mobility oscillator
The price-mode is the center of the bin with the largest distribution value during the lookback.
The mobility oscillator equals 100 times one minus the current-bin frequency over the modal-bin frequency. It is signed by whether the close is above or below the price-mode, and it is bounded from -100 to +100. Sparse bins map as high mobility and dense bins map as low mobility.
Illustrated lookback, bins, and a slow mobility oscillator
Illustrated constructions used a 14-bar lookback, 10 or 20 equal bins, and a seven-bar exponential average of the oscillator.
That exponentially smoothed series is the slow mobility oscillator. It is used to read trend direction and crossings.
Base-building in a stepped advance
In a stepped advance, breathing pauses that rebuild congestion and return the oscillator to zero are described as base-building before the next upward step.
Base-building is a pause in which congestion rebuilds and the oscillator returns toward zero before the next directional step.
A directional check and a two-sided overlay
When a break from congestion is expected but direction is unknown, one overlay is an options straddle. A stochastic oscillator is the companion used to assign direction.
The stochastic oscillator is range-normalized and shares the same high-low lookback window as the price-distribution function. The options straddle is a two-sided options overlay used when a mobility break is expected but direction is not specified.
All readings on this track · 17 readings
- 1994Cup-and-handle base construction and volume breakout
- 1996Constructing a mobility oscillator from price distributions
- 1996Float turnover as a construction rule for bases and breakouts
- 2001A historically derived growth checklist for entry, exit, and staying out
- 2003Base-building then breakout after a market bottom
- 2005Commodity group bases, breakouts and pennants
- 2005Logic-first construction of a base-break system
- 2005Quiet bases copied onto an intradacy clock
- 2005Failed cup-with-handle after earnings and float filters
- 2006Turning flat bases into breakout system rules
- 2007Base-building holds versus swing timing
- 2007Confirmed index highs, style-fit trend systems, and bases
- 2007Name the sideways regime before you test the breakout
- 2011A three-peaks-and-a-domed-house chart is not a complete timing model
- 2014Constructing a volume-capacity channel from a sideways base
- 2016Waves, bases, and the campaign log on a price chart
- 2020Ratio charts as regime context for relative strength and yield spreads