1996issue C121-6
Float turnover as a construction rule for bases and breakouts
Treat a consolidation as a construction problem. Add daily volume backward until the running total is at least the freely available share supply, then use that window's high and low as the trigger lines that later confirm or reject the base.
- One complete change of freely available share supply is built by adding daily volume backward from a chosen bar until the running total is at least that supply.
- The high and low of the backward volume-count window become the trigger lines: a close through the high is treated as a buy signal and a close through the low as a sell signal.
- A turnover base is a sideways range whose duration equals one complete backward volume count, observed after long declines, inside uptrends, and at tops.
- The same stock can stack more than one such range, and the construction is offered as a quantitative way to redefine consolidation, Base building, overhead supply, and Breakout confirmation.
Count the freely available share supply first
This historical workflow treats a consolidation as a construction problem. Daily volume is added backward from a chosen bar until the running total is at least the freely available share supply. The high and low of that window later serve as the trigger lines that confirm or reject the base.
Build the window with volume-price analysis
One complete change of freely available share supply is constructed by adding daily volume backward from a chosen bar until the running total is at least the freely available share supply. That count is a Volume-price analysis step. Base building and Breakout confirmation then use the finished window rather than a purely visual shape.
Use the high and low of the counted window
The highest and lowest prices inside that backward-count window become horizontal trigger lines. A close through the high is treated as a buy signal. A close through the low is treated as a sell signal.
Let the supply set the length
Turnover length is stock-specific. A small freely available share supply may take months or years to complete one count, while a large, actively traded supply may complete in days. The same stock can shift from long counts to very short ones under heavy accumulation.
A turnover base is defined as a sideways range whose duration equals one complete backward volume count of the freely available share supply. That construction is observed after long declines, inside uptrends, and at tops. The sideways range is the price range spanning one complete change of freely available share supply.
Illustrated bottoms, pauses, and tops
Illustrated bottom constructions include a 38-week sideways count and a 25-week count. Each ended when price crossed the window high.
An uptrend-basing construction can also last exactly one complete change of freely available share supply. One illustrated case was a 15-week sideways pause whose traded volume matched the freely available share supply before the window high was crossed.
Top constructions are built the same way. After one complete change of freely available share supply at the high, a break of the window low is the sell trigger. Illustrated counts were 5, 8, and 11 weeks.
Jones Medical weekly price through the 38-week float-turnover base
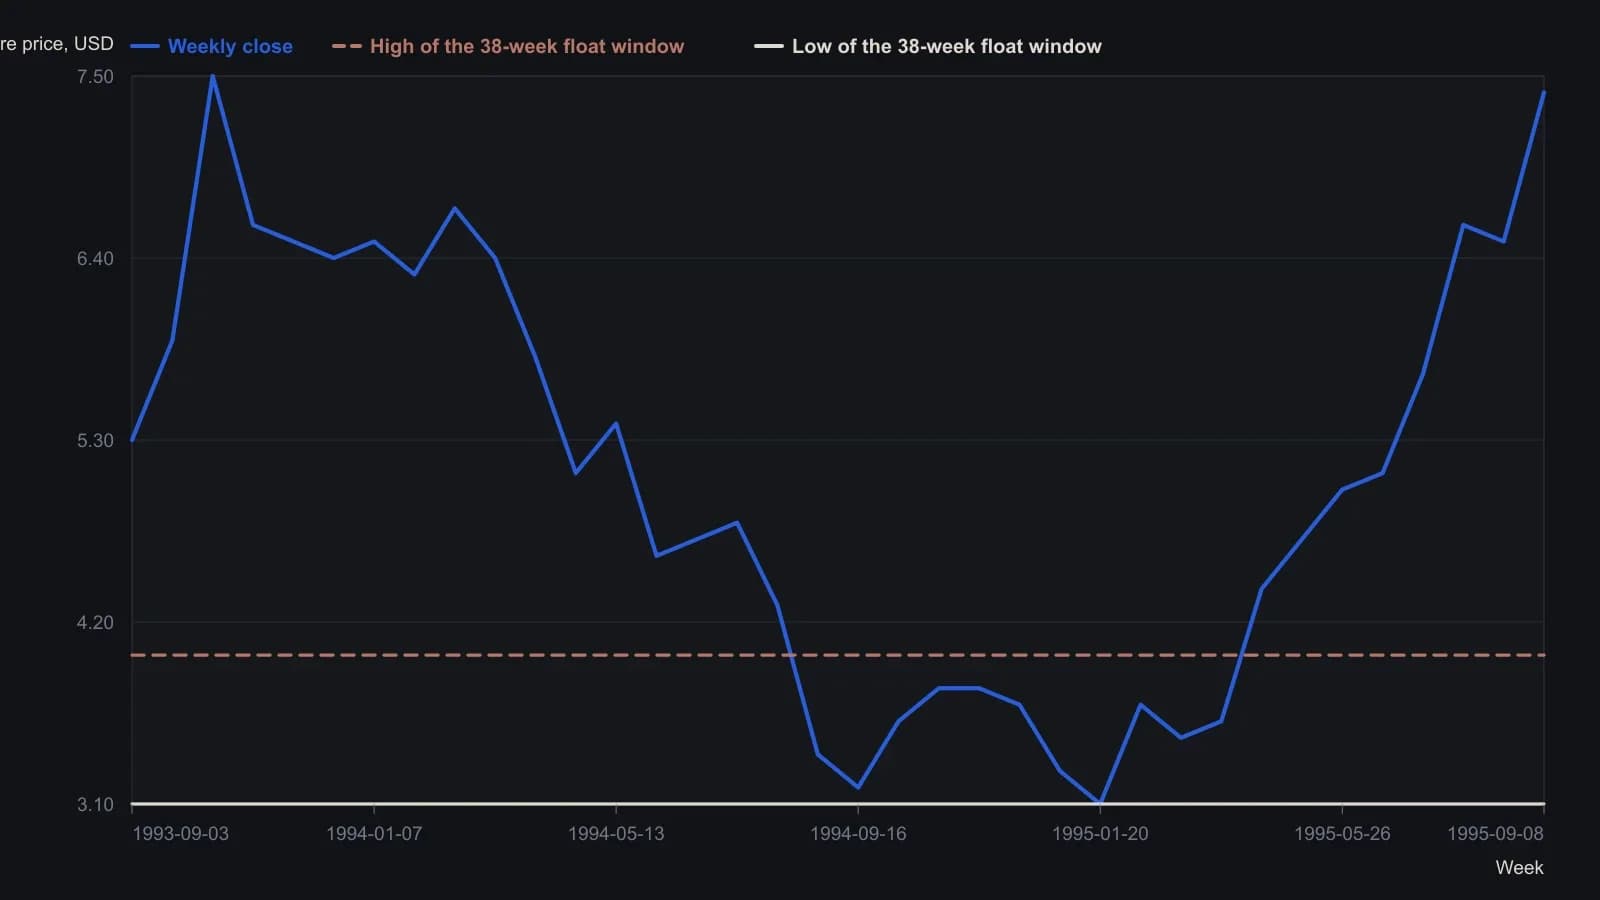
Closes estimated from printed weekly bars; reliable only to about 0.1. The plot is split-adjusted. The article’s $4–$6 buying zone is the unadjusted reading of this same window; the $4.0 trigger is the high of that band on the printed scale.
Stack more than one turnover base
The same stock can stack more than one turnover base. A long first count can be followed by a short multi-day pause after a rise, then by another upside resolution.
The construction is offered as a quantitative way to redefine consolidation, Base building, overhead supply, and Breakout confirmation. The area pattern is the price range of one complete change of freely available share supply, not a purely visual shape.
Editorial note
Editorial: TradersWeek reads this as a construction rule for Base building and Breakout confirmation. First finish the backward volume count of the freely available share supply. Then keep only the high and low of the backward volume-count window. A later close through those lines is what confirms or rejects the sideways range.
All readings on this track · 17 readings
- 1994Cup-and-handle base construction and volume breakout
- 1996Constructing a mobility oscillator from price distributions
- 1996Float turnover as a construction rule for bases and breakouts
- 2001A historically derived growth checklist for entry, exit, and staying out
- 2003Base-building then breakout after a market bottom
- 2005Commodity group bases, breakouts and pennants
- 2005Logic-first construction of a base-break system
- 2005Quiet bases copied onto an intradacy clock
- 2005Failed cup-with-handle after earnings and float filters
- 2006Turning flat bases into breakout system rules
- 2007Base-building holds versus swing timing
- 2007Confirmed index highs, style-fit trend systems, and bases
- 2007Name the sideways regime before you test the breakout
- 2011A three-peaks-and-a-domed-house chart is not a complete timing model
- 2014Constructing a volume-capacity channel from a sideways base
- 2016Waves, bases, and the campaign log on a price chart
- 2020Ratio charts as regime context for relative strength and yield spreads