1999issue C111-5
Take the rectangular-base breakout from money-flow confirmation, not from a late strength average
A money-flow-index trendline break times when money is already moving into or out of the instrument inside a rectangular base. Average Directional Index only certifies later that a directional average has caught up. The archive workflow initiates on the confirmed breakout, not on a 25-crossing.
- A rectangular base is oscillating price with similar highs and similar lows. The combination is built to leave that range, not to trade the range itself.
- Range expansion is not enough. A money-flow-index trendline break inside a five-day confirmation window is what shows that money is moving into or out of the instrument.
- Average Directional Index reports whether movement is directional and how strong it is, not which way it points. Because it is a simple moving average, it can stay below 25 until after the paired signal has already marked the range exit.
- The intended initiation is the confirmed breakout from the base. Stops, position size, and an exit plan still apply, and a long breakout against a broader decline remains risky.
A two-clock reading of early-trend work
This article treats early-trend work as a two-clock problem. That framing is editorial, not an archive label. On the faster clock, a money-flow-index trendline break is the confirmation that money is moving into or out of the instrument. On the slower clock, a later rise in Average Directional Index only certifies that a directional average has caught up.
The practical point is why the breakout from a rectangular base is taken from the faster pair rather than from a 25-crossing on trend strength. The archive describes the faster pair as a range-expansion bulge plus a noncoincident money-flow-index confirmation. The slower reading is the strength average itself.
The rectangular base is not the trade
A rectangular base is oscillating price action made of similar highs and similar lows. It is a nontrending stretch, not a trade by itself. A later uptrend is described as a sequence of higher lows followed by higher highs. The combination is designed to leave the base once confirmation is in place.
A reversal bulge only warns that range has expanded
A range-expansion bulge, used here as a reversal bulge, is defined as the mass-index line rising from below through both fixed setup and trigger levels and then crossing back down through both. After that sequence, the intended follow-through is a breakout from the consolidation range.
Range expansion by itself is treated as insufficient for reliable trend identification. A noncoincident money-flow-index confirmation is required to show that money is moving into or out of the instrument.
How money-flow confirmation is read
In the supplied construction, the money-flow index is a 14-period, volume-weighted analog of relative strength. Typical price times volume is summed separately on up and down average-price days, then scaled to a 0-100 oscillator.
Confirmation is not a fixed oscillator level. It is read from a series of higher or lower highs and lows. A trendline is drawn across the money-flow highs, and a break of that line is the confirmation event. That break is what the archive uses to show that buyers or sellers are actually entering.
The five-day confirmation window
Historical tests required the money-flow-index signal to fall within five trading days before or after the range-expansion signal. That five-day confirmation window is the tested rule. Confirmation windows longer than five days were reported as inferior.
The paired signal is described as rare once a trend is already underway. It occurs mainly while price is still oscillating. The money-flow-index signal usually, but not always, arrives a few days after the range-expansion signal.
Why Average Directional Index arrives late
Average Directional Index is a 0-100 trendiness reading. It reports whether movement is directional and how strong that movement is, not which way it points. A common rule in the evidence is that directional movement has resumed when the average passes through 25 and is rising.
Because Average Directional Index is a simple moving average of directional movement, the evidence argues it lags an exponential range measure plus a money-flow-index filter. In the worked comparison, the average did not exceed 25 until after the paired signal had already marked the range exit.
Dell ADX crosses 25 only after the rectangular-base breakout
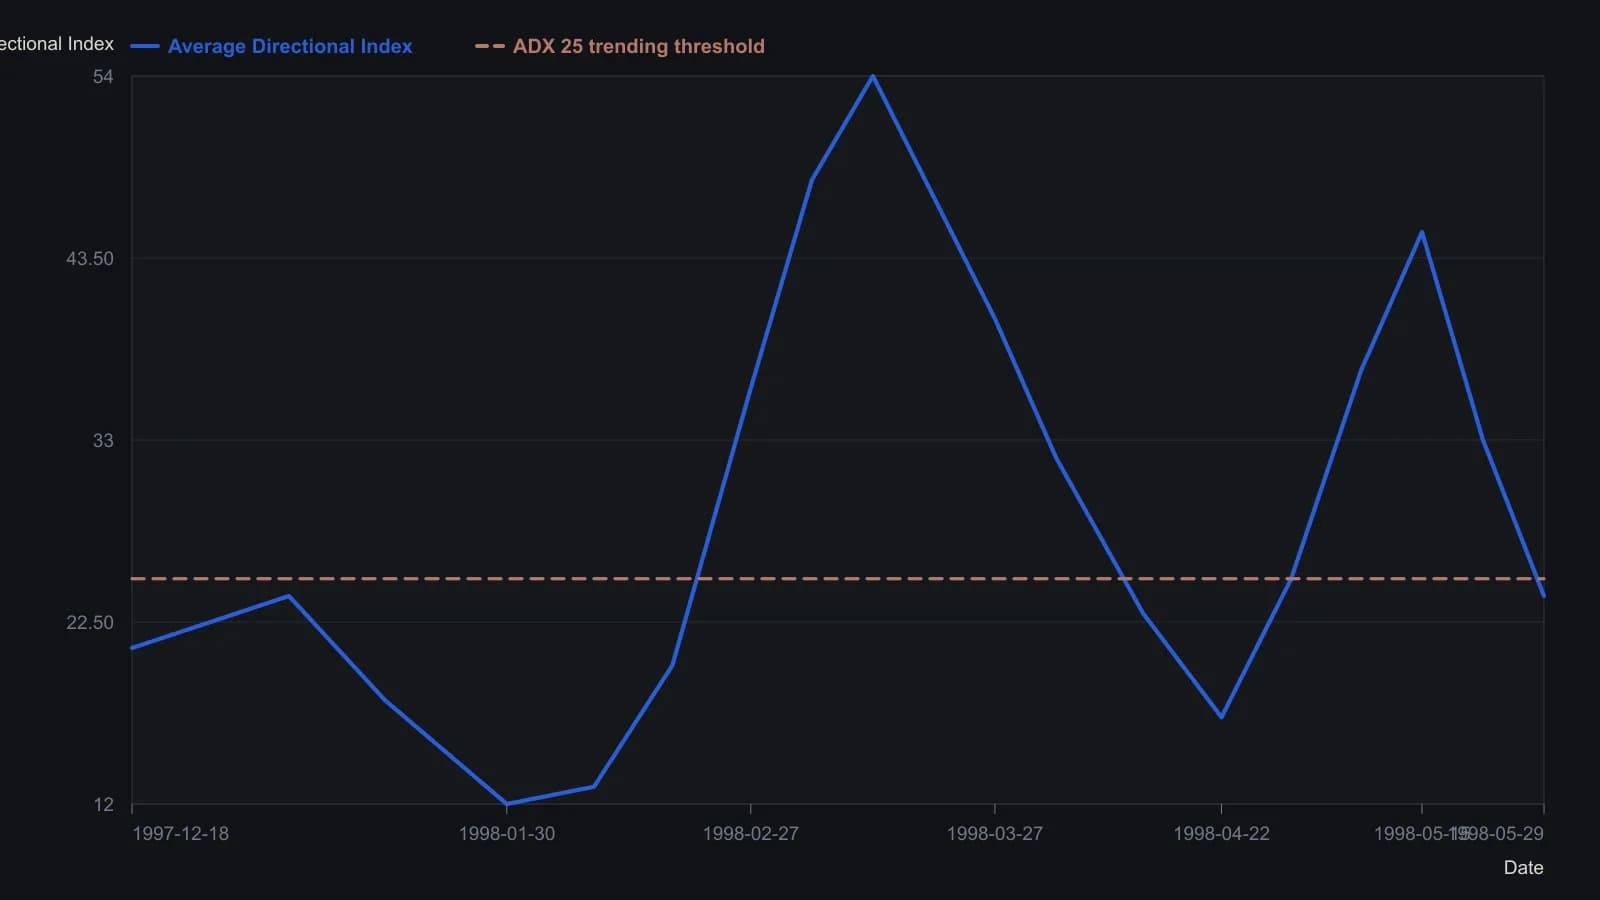
ADX points are approximate readings from axis ticks at 20, 30, 40 and 50. The source states ADX first exceeded 25 on 30 April 1998 at a close of 19 3/4, versus an entry through 17 on the 21 April breakout. It attributes the lag to ADX being a simple moving average of Wilder's directional movement index.
The breakout is the initiation
The intended initiation is the breakout from the rectangular base after confirmation. The reversal bulge is a warning that average daily range has expanded and that a directional change may be near. The money-flow-index break is confirmation that buyers or sellers are actually entering. Neither of those events is the entry.
The breakout is the exit of price from the rectangular base after the range-expansion and money-flow-index clocks have already fired. That is the initiation event rather than the bulge or the later strength-average cross.
The evidence states that entries still require stops, position size, and an exit plan. A long breakout against a broader decline remains risky.
All readings on this track · 13 readings
- 1988Constructing tick-weighted money flow and price divergences
- 1989Four-state money-flow-index as permission for a next-bar breakout-system
- 1989Constructing a suggest-then-confirm Money Flow Index
- 1993Five-rung money flow from signed print volume
- 1993Physics analogies for building cycle and money flow indicators
- 1994Keep a wave count as a draft until money flow and a trendline agree
- 1999Take the rectangular-base breakout from money-flow confirmation, not from a late strength average
- 2004Constructing a volume-flow rule from money flow
- 2006Classify the regime before the bar read
- 2015Constructing a bounded money-flow oscillator from range and volume
- 2016Combining RSI, moving averages, and money flow
- 2018Five-rule technical rating as a rotation filter
- 2020Combining money-flow, RSI, and breadth for dynamic pressure zones