2014issue C0232-37
Constructing a volume-capacity channel from a sideways base
A sideways accumulation range becomes a tradable hypothesis only after it is rebuilt as a volume-capacity channel. Count the shares that have already changed hands, place an executable Volume-weighted average price midline inside the horizontal Price channel, and treat a break of that envelope as a direction test rather than a prediction.
- A four-phase cycle of accumulation, advance, distribution, and decline need not run in a fixed order, and more than one horizontal base can interrupt a single uptrend.
- Accumulation is a quiet stretch of fading public interest, shrinking activity and volatility, and often waning liquidity, while longer-horizon holders absorb shares from sellers who want out.
- The setup is built by reading a horizontal accumulation channel against share turnover since a prior low, treating that turnover as capacity that depletes remaining distressed holders.
- A break of the constructed envelope is a direction test, not proof that an uptrend will begin, and repeated entries can be stopped out if price falls back into the band.
A quiet base inside a four-phase cycle
Editorial note: a sideways accumulation range becomes a tradable hypothesis only after it is rebuilt as a volume-capacity channel. The rebuild counts shares that have already changed hands, places an executable Volume-weighted average price midline inside the horizontal band, and treats a break of that constructed envelope as a direction test rather than a prediction.
A four-phase market cycle is described as accumulation, also called basing, then advance with higher highs and higher lows, then distribution in a top area, then decline with lower tops and lower bottoms.
Those phases need not occur in a fixed sequence. Multiple accumulation stages can interrupt a single uptrend and leave successive horizontal bases.
Accumulation is described as a period of fading public interest, shrinking activity and volatility, and often waning liquidity. In that stretch, longer-horizon holders absorb shares from sellers who want out. That quiet Base building condition is the raw material for the channel, not yet a completed setup.
Building the volume-capacity channel
The setup is constructed by reading a horizontal accumulation channel against share turnover since a prior low. That turnover is treated as a capacity or healing process that depletes remaining distressed holders.
In the illustrated case, shares traded since the low equaled 75 percent of shares outstanding and 108 percent of free float.
While price remains in the sideways accumulation band, average daily volume can be used to project how quickly remaining free float may turn over. The Price channel is the horizontal band itself. The turnover count is what turns that band into a volume-capacity envelope rather than an unmarked pause.
Nyrstar daily capacity channel in the 2008–09 base
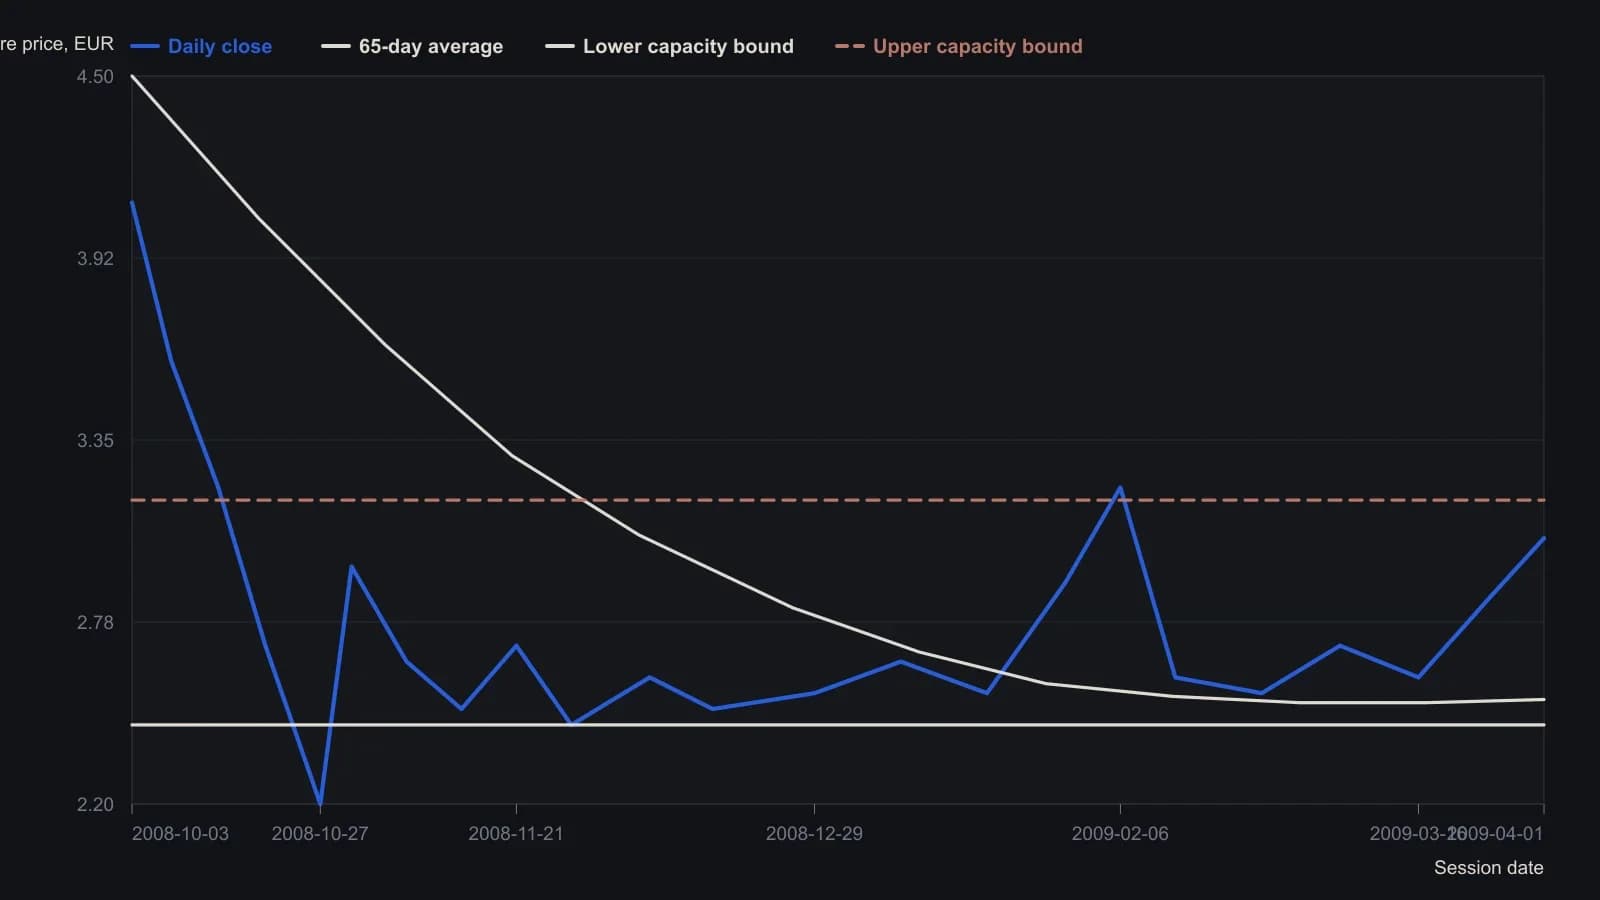
Chartmill upper and lower channels are the labeled 3.16 and 2.45 lines; the midline is the 65-session average that ends at 2.53. Intermediate price and average prints are approximate readings from the raster. The 1 April 2009 close of 3.04 is the session quoted on the source daily figure. The lowest point is the late-October 2008 washout named in the article.
The same condition at market level
The same Base building condition is presented as usable with breadth measures and as an earlier market-level tell that trending conditions may be returning after a decline. That reading still depends on the constructed band and the turnover capacity behind it, not on a claim that the next advance has already started.
All readings on this track · 17 readings
- 1994Cup-and-handle base construction and volume breakout
- 1996Constructing a mobility oscillator from price distributions
- 1996Float turnover as a construction rule for bases and breakouts
- 2001A historically derived growth checklist for entry, exit, and staying out
- 2003Base-building then breakout after a market bottom
- 2005Commodity group bases, breakouts and pennants
- 2005Logic-first construction of a base-break system
- 2005Quiet bases copied onto an intradacy clock
- 2005Failed cup-with-handle after earnings and float filters
- 2006Turning flat bases into breakout system rules
- 2007Base-building holds versus swing timing
- 2007Confirmed index highs, style-fit trend systems, and bases
- 2007Name the sideways regime before you test the breakout
- 2011A three-peaks-and-a-domed-house chart is not a complete timing model
- 2014Constructing a volume-capacity channel from a sideways base
- 2016Waves, bases, and the campaign log on a price chart
- 2020Ratio charts as regime context for relative strength and yield spreads