2012issue C0874-77
Constructing a bull-bear sector rotation overlay
A sector-rotation-oscillator subtracts an equal-weight defensive rate-of-change average from an equal-weight cyclical average, scales that spread, and sits under a daily S&P 500 chart as a macro sentiment gauge.
- A sector-rotation-oscillator is a scaled cyclical-versus-defensive rate-of-change spread used to classify broad-market regime on a weeks-to-months horizon.
- The bull-sleeve equally weights discretionary and financial rate of change; the bear-sleeve equally weights energy, utilities, and the third coded defensive series.
- Each sector series uses a lookback-window that defaults to 75 periods and can be set from 10 to 200 before the spread is scaled by 100.
- The oscillator is drawn as a histogram under a daily S&P 500 chart; extremes mark candidate turning points for the aggregate market, not a single-name entry.
What the overlay measures
The sector-rotation-oscillator is a scaled spread that subtracts average defensive-sector rate of change from average cyclical-sector rate of change to classify broad-market regime. The construction is specified as a macro sentiment gauge that rises and falls with the relative dominance of bullish versus bearish sector leadership.
Building the bull-sleeve and bear-sleeve
The bull-sleeve is an equal-weight average of rate of change in the discretionary and financial sector series. Those inputs are coded as XLY and XLF. The pair is divided by two before the spread is formed.
The bear-sleeve is an equal-weight average of rate of change in the energy, utilities, and third coded defensive sector series. Those inputs are coded as XLE, XLU, and XLP. The trio is divided by three before the spread is formed.
Lookback-window and scaled spread
Each sector input is a rate of change whose lookback-window defaults to 75 periods and is parameterized from 10 to 200. The overlay is built as 100 times the difference between the averaged bullish-sector rate of change and the averaged bearish-sector rate of change.
Reading it on the index chart
The finished oscillator is applied to a daily S&P 500 chart and is commonly drawn as a histogram beneath the index. Oscillator extremes are intended as candidate turning-point markers for the aggregate equity market, not as a single-name entry rule.
How implementations compute it
Implementations compute the same object by pulling external sector closes, taking period-over-period change, averaging inside each sleeve, and returning the scaled intermarket spread.
75-day sector-rotation oscillator on the S&P 500, 2008–2012
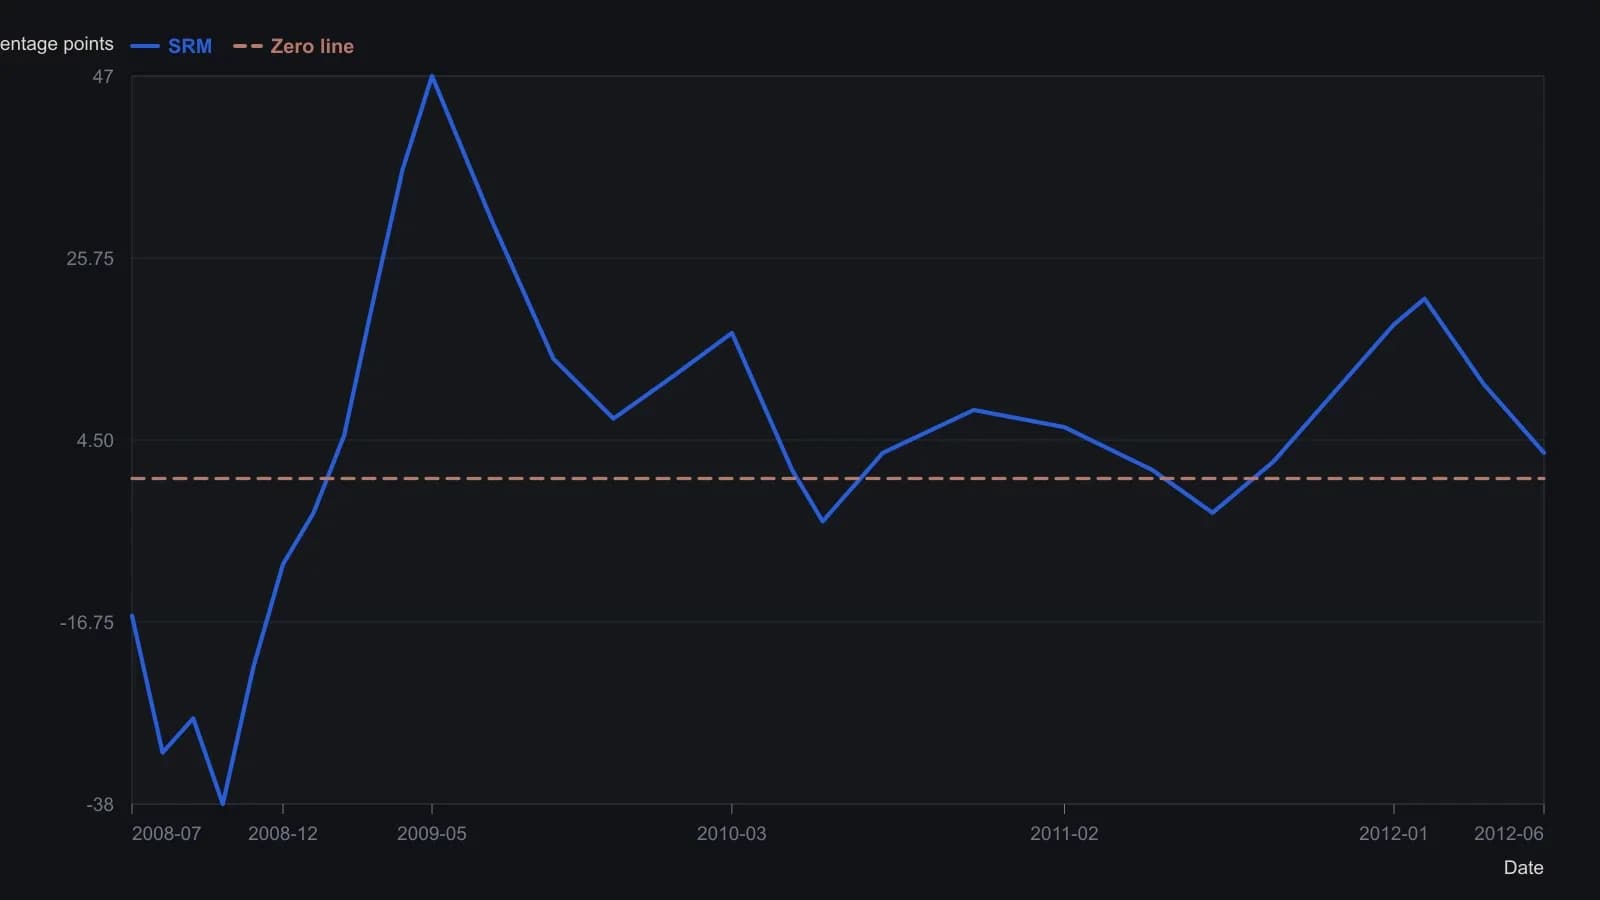
The source screenshot fixes the rate-of-change lookback at 75 trading sessions. Bar heights are digitised from a labeled −40 to +50 raster and are not tick-precise.
All readings on this track · 10 readings
- 2001Constructing relative-strength ratios for spreads and rotation
- 2001Sector rotation, timing and leverage as a regime case study
- 2004Read one stock idea as a late-cycle puzzle
- 2004Always-on delayed-weak and live-strong sector sleeves
- 2012Building a sector-rotation histogram from rate-of-change spreads
- 2012Constructing a bull-bear sector rotation overlay
- 2012A relative-performance heatmap for pairs trading and sector rotation
- 2014Evaluating an annual contrarian sector rank-rotation
- 2014A ranking workflow that treated sector rotation as an abstention procedure
- 2015A nine-sector sleeve drill on the business-cycle map