2012issue C0957-59
A weekly stock list scored for rank rotation and industry rotation
A historical Saturday packet scored a stored stock list on one three-to-six-month multi-factor score, then used an industry grid to frame a same-group swap or a move out of a weak group. The holder kept the final decision.
- Rank rotation on this list meant reviewing every holding against one shared multi-factor score aimed at a three-to-six-month window, not against price indicators alone.
- Market-breadth context judged one name against how many holdings and industry groups sat on the constructive versus cautionary side of the same rating.
- Industry rotation treated a weak name as a same-group swap or as a reason to leave the group, instead of reviewing each symbol in isolation.
- Earnings surprises and estimate revisions sat beside rank changes so a flip could be checked against the latest fundamental updates.
One score for the whole book
A weekly holdings-review service combined about twenty inputs, including valuation ratios, analyst activity, and short-interest positioning, into one multi-factor score. That score was aimed at a three-to-six-month window rather than at price indicators alone.
After a symbol list was stored, an automated Saturday report labeled the book constructive or weak. It stated what share of names were rated likely to lead or lag over the next three to six months, and it counted how many holdings sat on the bullish versus bearish side of the score.
In the illustrated book of 88 names, 32 carried a bullish or very bullish rating and 27 carried a bearish or very bearish rating that the report marked for further review.
What the weekly packet added
The weekly packet listed the largest percentage gainers and losers, compared the list’s average weekly change with a broad equity index, and named holdings whose ratings had just turned bullish or bearish.
Separate tables reported earnings surprises and estimate revisions so a rank change could be read against the latest fundamental updates. The packet also listed upcoming earnings dates for names in the book.
Largest one-week winners and losers on the sample Chaikin list
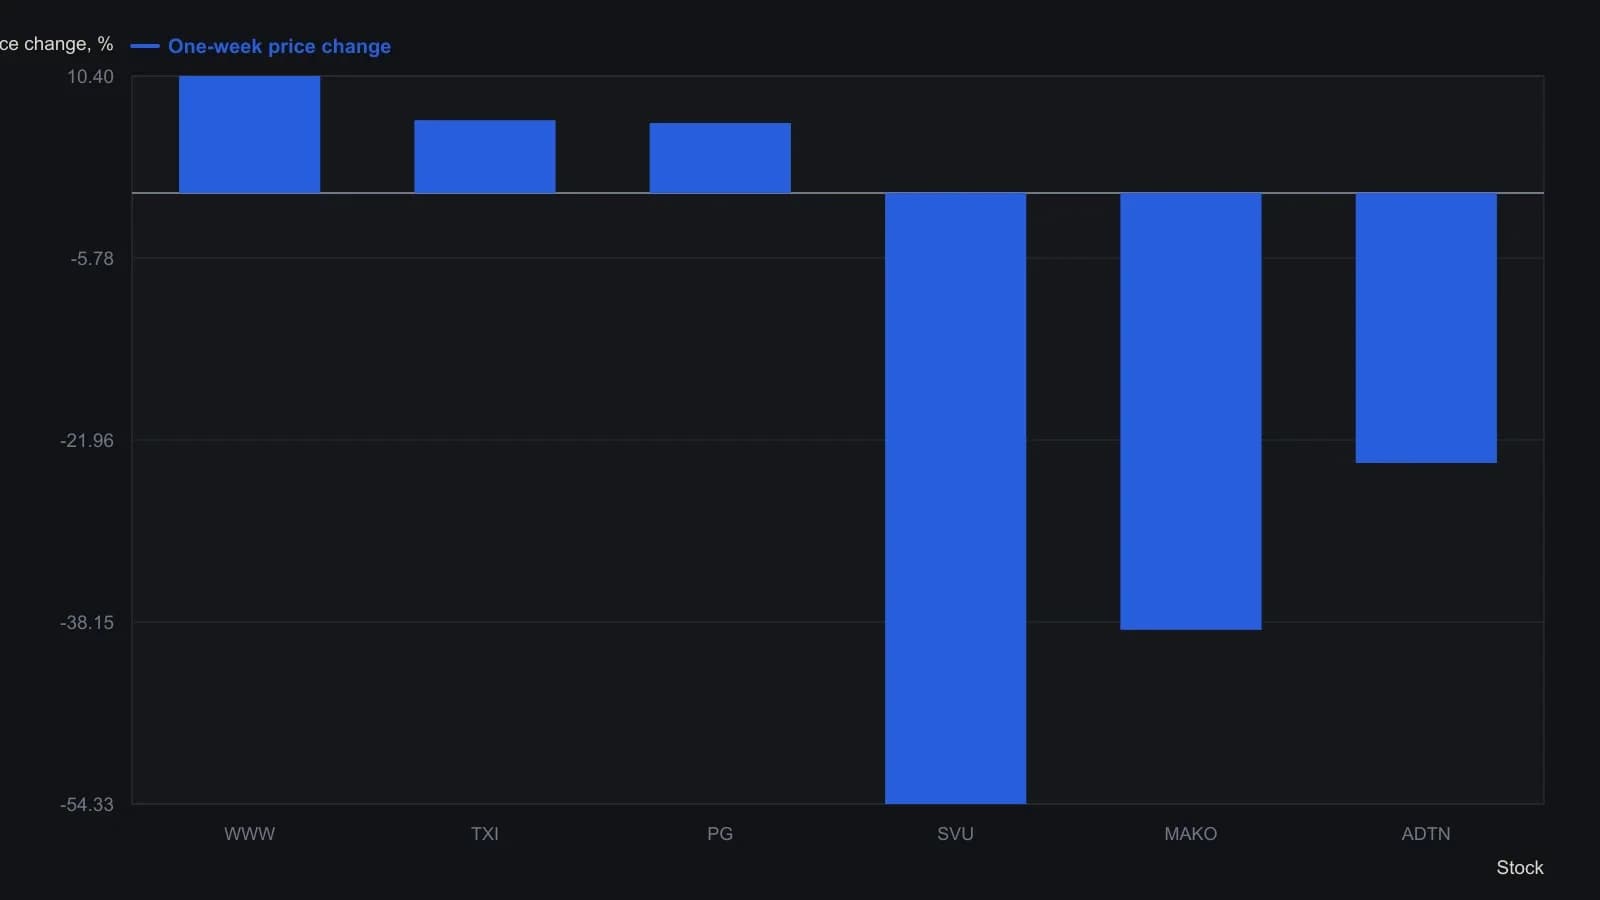
Sample list dated week of 15 July 2012. The same report stated the S&P 500 at +0.19 percent and the list average at -2.33 percent; those two comparison figures are not drawn.
Industry grid and construction choices
A companion industry grid derived from the same ratings identified strong and weak industry groups and the strong and weak stocks inside those groups.
The construction workflow proposed a same-group swap, replacing a weaker holding with a stronger peer in the same industry, or industry rotation that left a weak industry group for a stronger group. It did not treat each name in isolation.
A compact view, not a substitute for the holder
The write-up presented the weekly format as a way to compress many analyst-style inputs into a simple view of strengths, weaknesses, and opportunities. It stated that the final decision remained with the holder.