2018issue C0422-26
Range-based volatility as a true-range construction
Volatility can be measured from returns or from ranges. This note treats the choice as a construction problem: build a true-range scale that sees the opening gap, the intraday span, and price drift, then use that same scale to read historical volatility and to bound position size.
- Volatility is variation in the price of a tradable asset over a chosen interval and can be measured from either returns or ranges.
- A range-based estimate that stays usable when price drift is present needs both intraday and close-to-close prices and must account for the opening gap.
- True range already includes intraday prices and opening gaps; restated as a logarithmic ratio it can be compared with later range-based estimators.
- True-range construction keeps the measured range larger than the same bar's drift, so directional travel cannot swallow the volatility reading.
Volatility as a construction problem
Volatility can be defined as variation in the price of a tradable asset over a chosen interval and can be measured from either returns or ranges.
Return-based intervals use known event times. Range-based intervals generally record only the start and end of the window, not the exact time of the high or low.
Editorial: the interval is the yardstick. A scale that cannot see the opening gap, the travel inside the bar, or price drift will hand a distorted reading to any later regime view or position bound.
What the range must include
Parkinson's 1980 high-low estimator is more efficient than close-to-close standard deviation because it uses intraday movement, but it omits opening gaps and assumes no meaningful price drift.
A successful range-based volatility estimate should include both intraday and close-to-close prices, account for opening gaps, and remain usable when significant drift is present.
True range as the working scale
True range is the single-bar span from the higher of today's high or yesterday's close to the lower of today's low or yesterday's close. Wilder's true range already includes intraday prices and handles opening gaps.
Restating true range as a logarithmic ratio lets it be compared with later range-based estimators. Root-mean-square true range percent is that restatement combined as a root-mean-square and scaled to an annualized percentage.
Modified Rogers-Satchell uses high, low, open, and the prior close so both drift and opening gaps enter the estimate. On ten years of SPY data ending September 29, 2017, annualized modified Rogers-Satchell volatility and annualized root-mean-square true range percent showed a close correspondence.
Relative to the standard deviation of returns, true range captures intraday movement while still registering opening gaps and drift. True-range construction keeps the measured range larger than the same bar's drift, so directional travel cannot swallow the volatility reading.
One scale for regime and size
Historical volatility is a past-looking estimate of how much a market has moved, built from observed prices rather than from option prices. Implied volatility infers a forward-looking reading from option prices rather than from completed bars.
ATR position sizing is a way to scale a trade so that account risk stays within a pre-set bound once stop distance is measured in true-range units.
Editorial: the archive's workflow is the construction of the range. TradersWeek's interpretation is that the same true-range scale can describe the market regime and can bound how large a position may be, because both jobs use one yardstick that still sees gaps, intraday travel, and drift.
True-range RMS versus VIX on the same price path
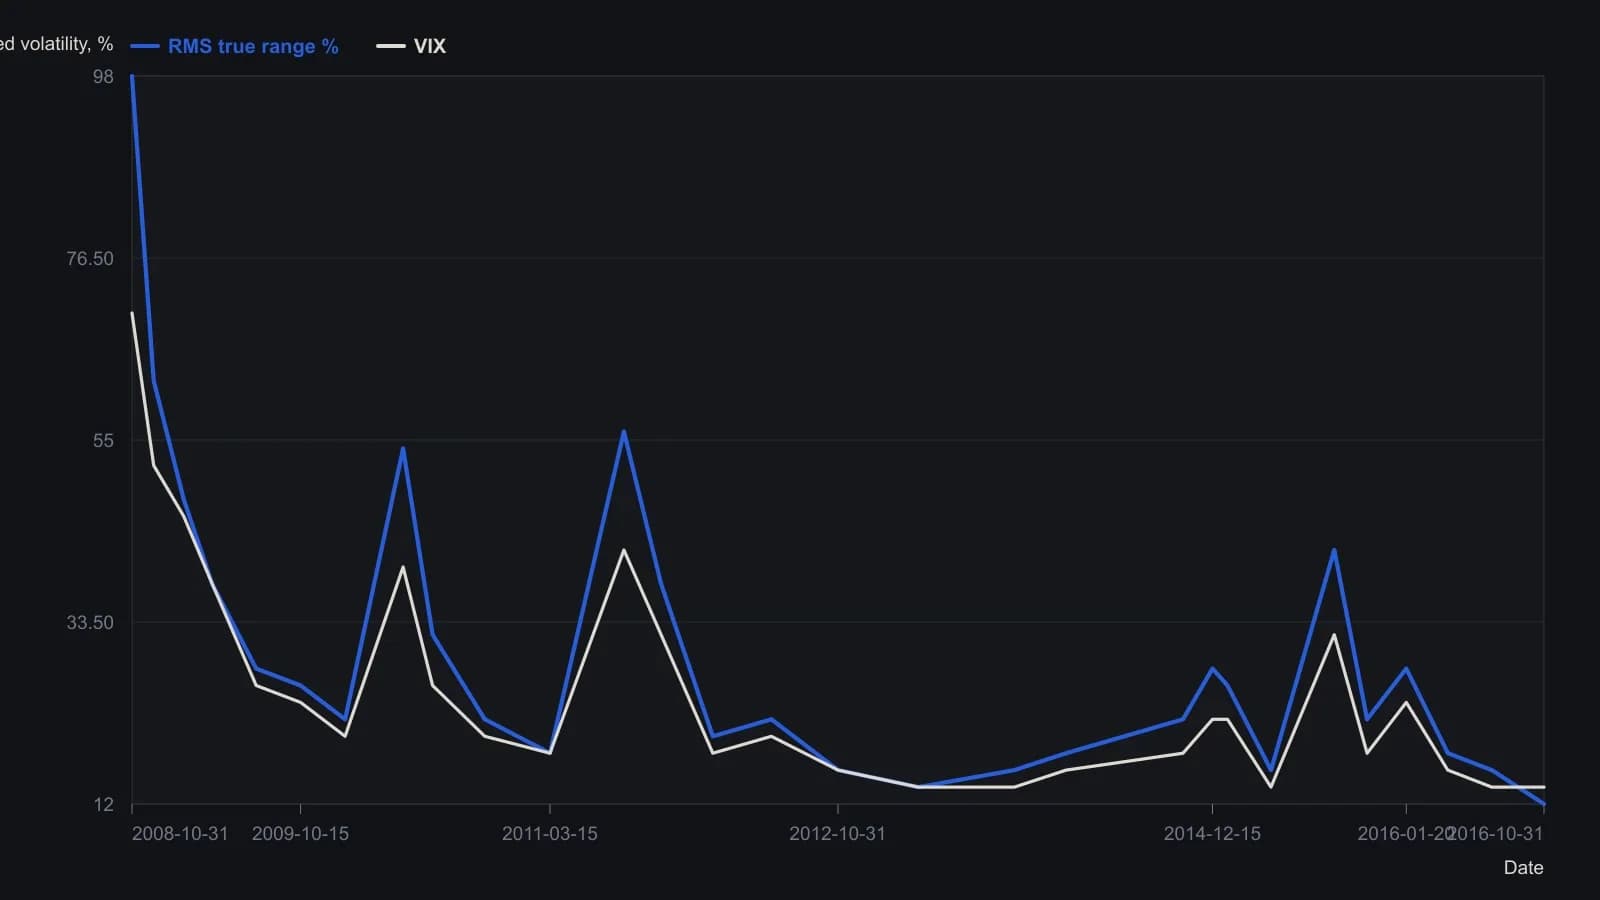
Dual-axis source: price on the left (0–300), annualized volatility percent on the right (0–100). Points are sampled from the raster, so spike peaks are approximate to the nearest percent.
All readings on this track · 36 readings
- 1988Constructing unsigned true range for directional models
- 1989Evaluate an always-in ATR breakout as one procedure
- 1992Variable lookback and average true range as a trend-filter construction
- 1993A random-walk index that uses true range as its scale
- 1993A shared harness for trend-filter construction
- 1998Finish a trend with a volatility trail, wave permission, and a slower-frame veto
- 1999A trend filter that switches tactics and scales ATR targets
- 2001Filter higher lows with linear regression, then judge the exit
- 2003A Mechanical trading system is a maintained procedure, not only an entry trigger
- 2005Construction of a volatility-bounded long entry
- 2005Six-zone encoding of open, high, low, and close
- 2006Normalized average true range as a pre-entry volatility bound
- 2006Chandelier exits, ATR position sizing, and trailing stops
- 2007Constructing a rule-based entry with Relative Strength Index and ATR position sizing
- 2008Constructing a zero-lag TMA and heikin-ashi crossover as a complete rule set
- 2010Use the session-range percent stop as a pre-trade filter
- 2011OCA exit groups, trailing limits, and ATR stops
- 2011ATR bands around support and resistance for stops and targets
- 2013Algorithmic head-and-shoulders construction with bounded exits
- 2013Constructing ATR-scaled swing pivots and linear-regression divergence
- 2013Constructing volatility bands from typical price
- 2014Constructing true-range contraction filters before expansion
- 2015Constructing touch plans from modified true range
- 2015One checklist for breakout entry and ATR risk
- 2015Percentage true-range construction for cross-market volatility filters
- 2015Construct a percentage true range for cross-market volatility
- 2015Percentage true range as a pre-entry exposure filter
- 2016Constructing ATR-filtered breakout entries
- 2017A dividend date as a pairs-trading classroom
- 2018Range-based volatility as a true-range construction
- 2018Moving average support and volatility-band construction
- 2018Construct a lifecycle breakout from compression
- 2018Pair the book first and let volatility or range set the size
- 2019Trend systems need a no-trade rule
- 2020Average true range as a shared unit for size, pairs, and stops
- 2020Volatility sizing and target-risk leverage as a pre-trade gate