2006issue C051-7
Normalized average true range as a pre-entry volatility bound
Average true range becomes a comparable exposure input when it is divided by closing price and scaled as a percent. That series can filter and rank instruments before a position is sized, then keep residual exposure bounded while the position is open.
- Normalized average true range is average true range divided by closing price and multiplied by 100, so the same volatility input can be compared across instruments before a position is sized.
- A user-chosen cutoff on that series can serve as a pre-entry filter, so only instruments with a sufficiently large range-as-percent-of-price are treated as active candidates.
- Instruments can be ranked or selected by the same reading, directing exposure toward the larger volatility-to-price market rather than an arbitrary primary symbol.
- After entry, a chandelier stop placed a multiple of range from a recent extreme keeps residual exposure bounded with the same volatility input that sized the trade.
From raw range to a percent of price
A normalized average true range is constructed as average true range divided by closing price and multiplied by 100, so the same volatility input can be compared across instruments before a position is sized.
ATR position sizing uses a volatility-and-stop-distance measure, together with account equity, to keep a loss or exposure decision bounded before entry and while the position is open.
Three steps and an adjustable lookback
The same construction is assembled in three explicit steps: compute true range, average it over the chosen length, then divide that average by closing price and scale it as a percent.
True range is a bar-by-bar range that includes the gap from the prior close, then averaged over a chosen lookback.
The construction commonly takes a 14-bar average true range as the default lookback, with that length exposed as an adjustable input rather than a fixed constant.
A cutoff and a ranking before entry
A threshold on the normalized series can be used as a pre-entry filter: values above the cutoff are plotted or ranked so that only instruments with sufficiently large range-as-percent-of-price are treated as active candidates.
That cutoff is a threshold filter, a user-chosen normalized-range cutoff that marks when volatility is high enough to treat as an exposure or ranking signal.
Once the normalized range is available, instruments can be ranked or selected by that value so that exposure is directed toward the market with the larger volatility-to-price reading rather than toward an arbitrary primary symbol.
The same volatility input after entry
After entry, residual exposure can stay bounded by a trailing stop placed a multiple of range from a recent extreme, so the volatility input that sized the trade also governs how long the position may remain open.
That trailing exit is a chandelier stop: a trailing exit placed a multiple of range away from a recent extreme, used to keep residual risk bounded after entry.
N-ATR filtered system IRR versus equity-index benchmarks
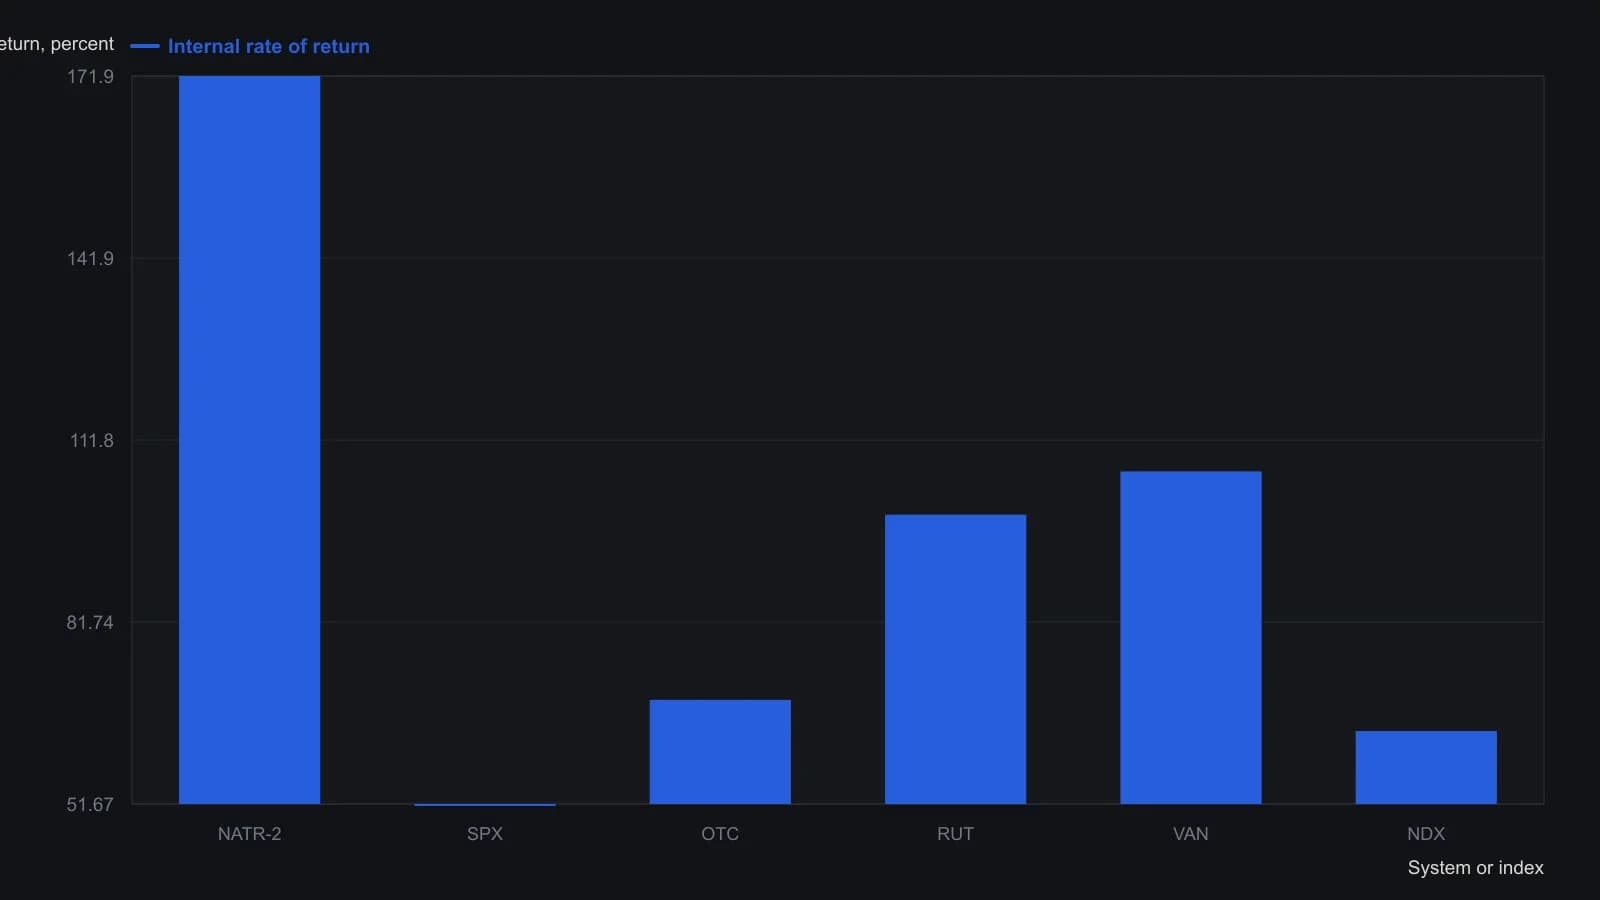
AIQ bought when five-day RSI was oversold and price was above the 50-day average, exited after five sessions, and restricted entries to an N-ATR min/max band on a Nasdaq 100 plus S&P 500 list. The printed window is 28 February 2003 to 2 January 2006.
A separate nonprice study
The normalized series is typically plotted as a separate nonprice study, with an optional overlay of the raw average true range, so the percent-of-price bound can be inspected independently of the price scale.
All readings on this track · 36 readings
- 1988Constructing unsigned true range for directional models
- 1989Evaluate an always-in ATR breakout as one procedure
- 1992Variable lookback and average true range as a trend-filter construction
- 1993A random-walk index that uses true range as its scale
- 1993A shared harness for trend-filter construction
- 1998Finish a trend with a volatility trail, wave permission, and a slower-frame veto
- 1999A trend filter that switches tactics and scales ATR targets
- 2001Filter higher lows with linear regression, then judge the exit
- 2003A Mechanical trading system is a maintained procedure, not only an entry trigger
- 2005Construction of a volatility-bounded long entry
- 2005Six-zone encoding of open, high, low, and close
- 2006Normalized average true range as a pre-entry volatility bound
- 2006Chandelier exits, ATR position sizing, and trailing stops
- 2007Constructing a rule-based entry with Relative Strength Index and ATR position sizing
- 2008Constructing a zero-lag TMA and heikin-ashi crossover as a complete rule set
- 2010Use the session-range percent stop as a pre-trade filter
- 2011OCA exit groups, trailing limits, and ATR stops
- 2011ATR bands around support and resistance for stops and targets
- 2013Algorithmic head-and-shoulders construction with bounded exits
- 2013Constructing ATR-scaled swing pivots and linear-regression divergence
- 2013Constructing volatility bands from typical price
- 2014Constructing true-range contraction filters before expansion
- 2015Constructing touch plans from modified true range
- 2015One checklist for breakout entry and ATR risk
- 2015Percentage true-range construction for cross-market volatility filters
- 2015Construct a percentage true range for cross-market volatility
- 2015Percentage true range as a pre-entry exposure filter
- 2016Constructing ATR-filtered breakout entries
- 2017A dividend date as a pairs-trading classroom
- 2018Range-based volatility as a true-range construction
- 2018Moving average support and volatility-band construction
- 2018Construct a lifecycle breakout from compression
- 2018Pair the book first and let volatility or range set the size
- 2019Trend systems need a no-trade rule
- 2020Average true range as a shared unit for size, pairs, and stops
- 2020Volatility sizing and target-risk leverage as a pre-trade gate