2006issue C111-4
Chandelier exits, ATR position sizing, and trailing stops
Editorial view: treat the exit as a three-part contract written before the order is sent. The archive describes an ATR-scaled chandelier distance, an equity fraction that converts that distance into size, and a trailing rule that can reuse the same volatility budget if price overruns the objective.
- A hard stop is meant to be set before the order is placed, because a loss that is already visible makes the exit harder to accept.
- A chandelier exit hangs an ATR multiple from the highest high or highest close so the stop distance expands and contracts with volatility.
- For shorter horizons, ATR position sizing caps planned loss at 2% of account equity and divides that dollar amount by the per-share distance to the stop.
- After price overruns a target, a trailing stop can be tightened so a small correction exits the remainder.
A hard stop before the order
A hard stop is meant to be set before the order is placed, because waiting until a loss is already visible makes the exit harder to accept. That working loss limit is entered with the order so the exit is decided before the position exists.
How the chandelier hangs
A chandelier exit hangs a multiple of average true range from the highest high or highest close over a 21-day window, commonly using a 10-day average true range scaled by three. The ATR multiple is adjustable for risk tolerance, time frame, and style.
The construction is a stop hung a multiple of average true range below a recent high or high close so the exit distance expands and contracts with volatility. Hanging the stop from the highest high is described as keeping the exit from rising, while a later shrink in average true range as a move matures is described as allowing the stop to tighten.
What average true range includes
Average true range is a volatility reading of typical daily range that also counts any gap from the prior close. Average true range includes the prior close so overnight gaps widen the reading. A high average true range is associated with a bottoming phase, and a low average true range is associated with consolidation or topping.
Size from the stop distance
ATR position sizing converts a planned stop distance and a fixed fraction of account equity into a maximum share count before entry. For shorter horizons, position size is obtained by capping planned loss at 2% of account equity and dividing that dollar amount by the per-share distance to the stop.
Variations and how far to hang
The chandelier construction can be varied by hanging from lows, changing the ATR multiple or lookback, substituting another range measure for average true range, and recalculating the exit daily. Stop distance is supposed to follow market direction, the entry setup, and time frame, with a longer horizon calling for a wider stop and planned reward at least twice planned risk.
A trail after the objective is overrun
A trailing stop is an exit that ratchets with favorable price so a later pullback, rather than a fixed level, closes the trade. After price overruns a target, a trailing stop can be tightened so a small correction exits the remainder.
AUY stop alternatives at the 10.30 long
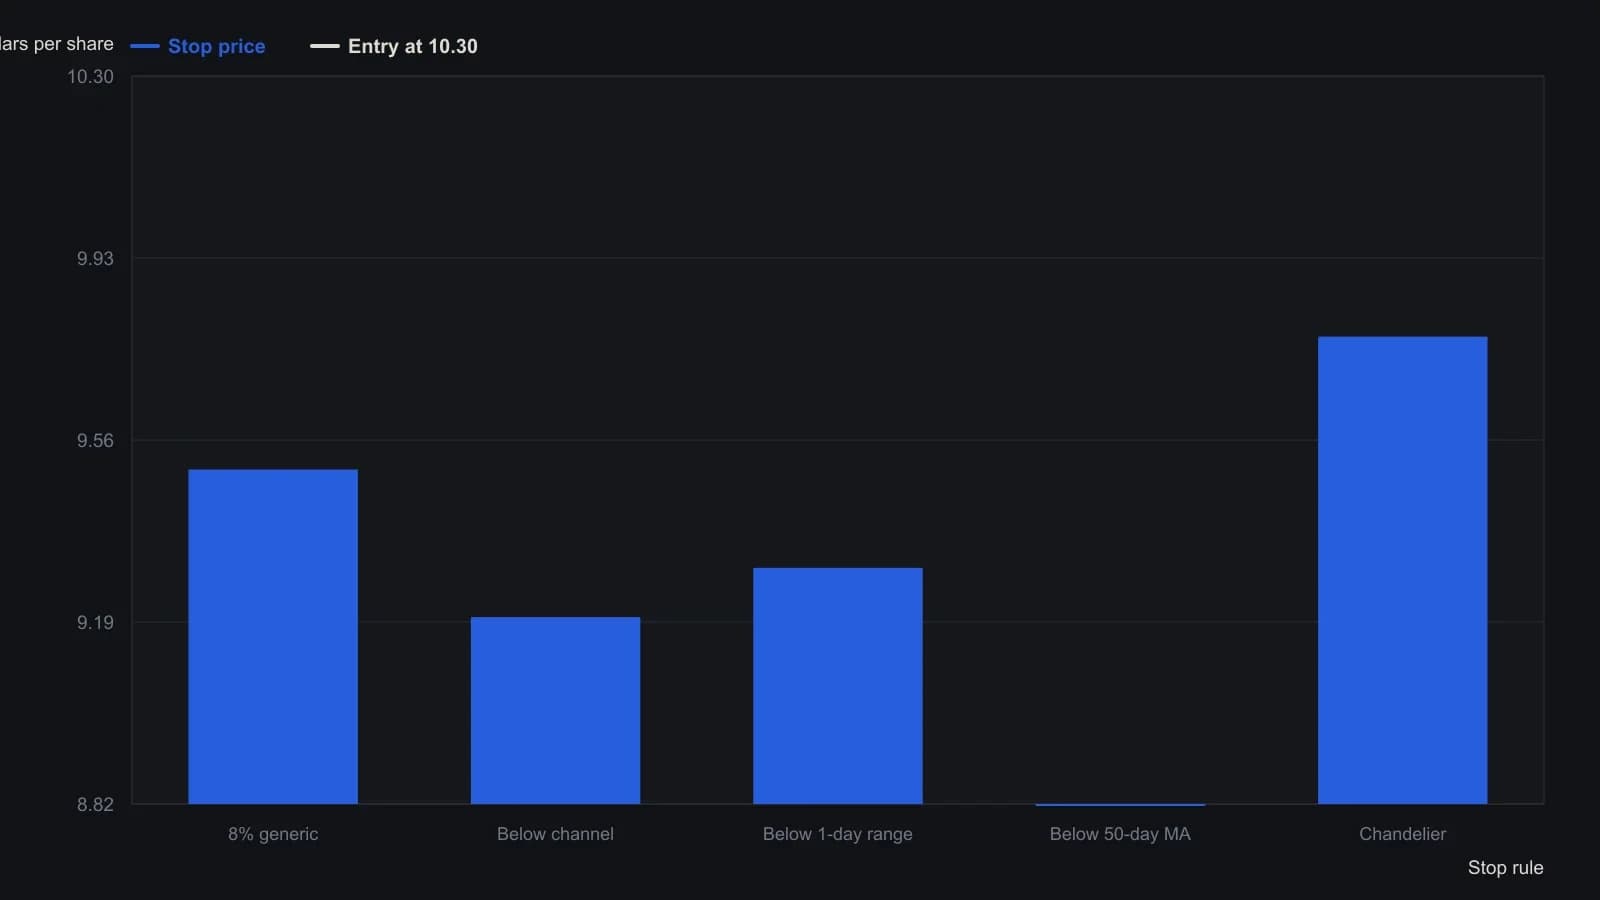
The chandelier band is given as 9.77–9.30. The 9.77 hang is 3 × ATR 0.55 from the 11.42 highest high; 9.30 hangs from the 10.91 highest close. The chart uses the 9.77 level she actually placed.
All readings on this track · 36 readings
- 1988Constructing unsigned true range for directional models
- 1989Evaluate an always-in ATR breakout as one procedure
- 1992Variable lookback and average true range as a trend-filter construction
- 1993A random-walk index that uses true range as its scale
- 1993A shared harness for trend-filter construction
- 1998Finish a trend with a volatility trail, wave permission, and a slower-frame veto
- 1999A trend filter that switches tactics and scales ATR targets
- 2001Filter higher lows with linear regression, then judge the exit
- 2003A Mechanical trading system is a maintained procedure, not only an entry trigger
- 2005Construction of a volatility-bounded long entry
- 2005Six-zone encoding of open, high, low, and close
- 2006Normalized average true range as a pre-entry volatility bound
- 2006Chandelier exits, ATR position sizing, and trailing stops
- 2007Constructing a rule-based entry with Relative Strength Index and ATR position sizing
- 2008Constructing a zero-lag TMA and heikin-ashi crossover as a complete rule set
- 2010Use the session-range percent stop as a pre-trade filter
- 2011OCA exit groups, trailing limits, and ATR stops
- 2011ATR bands around support and resistance for stops and targets
- 2013Algorithmic head-and-shoulders construction with bounded exits
- 2013Constructing ATR-scaled swing pivots and linear-regression divergence
- 2013Constructing volatility bands from typical price
- 2014Constructing true-range contraction filters before expansion
- 2015Constructing touch plans from modified true range
- 2015One checklist for breakout entry and ATR risk
- 2015Percentage true-range construction for cross-market volatility filters
- 2015Construct a percentage true range for cross-market volatility
- 2015Percentage true range as a pre-entry exposure filter
- 2016Constructing ATR-filtered breakout entries
- 2017A dividend date as a pairs-trading classroom
- 2018Range-based volatility as a true-range construction
- 2018Moving average support and volatility-band construction
- 2018Construct a lifecycle breakout from compression
- 2018Pair the book first and let volatility or range set the size
- 2019Trend systems need a no-trade rule
- 2020Average true range as a shared unit for size, pairs, and stops
- 2020Volatility sizing and target-risk leverage as a pre-trade gate