2013issue C0753-58
Constructing ATR-scaled swing pivots and linear-regression divergence
Historical scripts flipped a high-low swing state only after price crossed a combined percent and ATR threshold, then applied optional candle checks at those pivots. A second layer scored price-indicator divergence from linear-regression rates of change on close and volume, and a flag fired only when the standardized difference exceeded an input multiple.
- A high-low pivot threshold used a nonnegative percent of price, a nonnegative ATR-to-close multiple, or both, and rejected the case where both components were zero.
- Candle-pattern checks ran at zigzag pivot points, and each of upstep, downstep, gap-up, gap-down, engulfing, and harami could be enabled or disabled independently.
- Linear regression rates of change on closing price and volume were differenced and standardized, and price-indicator divergence flagged only when that value exceeded an input multiple.
- Editorial: keep the volatility-scaled state machine, the candle gate, and the divergence score as layers you can turn off and inspect on their own.
What the construction separated
Archive scripts tracked a high-low swing state, then allowed a candle-pattern check to fire only at the zigzag points where that state could change.
A second series pair, closing price and volume, was scored with linear-regression rates of change. Price-indicator divergence was the standardized difference of those two rates.
The coded pattern set included upstep, downstep, gap-up, gap-down, engulfing, and harami. A trend-state change that coincided with an enabled pattern was treated as the signal condition.
The high-low state machine
A high-low pivot threshold was built from a nonnegative percent of price, a nonnegative ATR-to-close multiple, or both. The construction rejected the case where both components were zero.
One script used default inputs of 5 for the percent and ATR length and 1.5 for the ATR factor. It flipped uptrend or downtrend only after price crossed the tracked extreme by that combined threshold.
Wave transitions were confirmed by breaking ATR-scaled thresholds. Step and engulfing marks were placed at those junctions rather than on every bar.
Editorial: read the ATR lookback and ATR factor as volatility inputs from ATR position sizing applied to the swing threshold. The archive workflow did not use those inputs to size account equity or to set a stop.
Candle checks at pivot junctions
Candle-pattern checks were applied at zigzag pivot points. Each listed pattern could be enabled or disabled independently.
One encoding mapped bullish patterns to the positive integers 1, 2, and 3 and bearish patterns to -1, -2, and -3 so the same detector could feed a later prediction or strategy layer.
Linear regression divergence on a second pair
A linear-regression rate of change was computed for volume and for closing price from each line's endpoints. The slope sign forced the rate's sign.
Price-indicator divergence was scored as the difference of those two rates divided by the standard deviation of the difference. A flag fired only when that standardized value exceeded an input multiple.
Inputs that keep layers inspectable
Implementations exposed zigzag percent, ATR lookback, ATR factor, line styling, and pattern selection as adjustable construction inputs.
Editorial: keep those inputs attached to their own layer. If a state flip, a candle match, and a divergence flag are wired as one object, you cannot tell which layer produced the event.
Ford daily high-low zigzag, April–August 2010
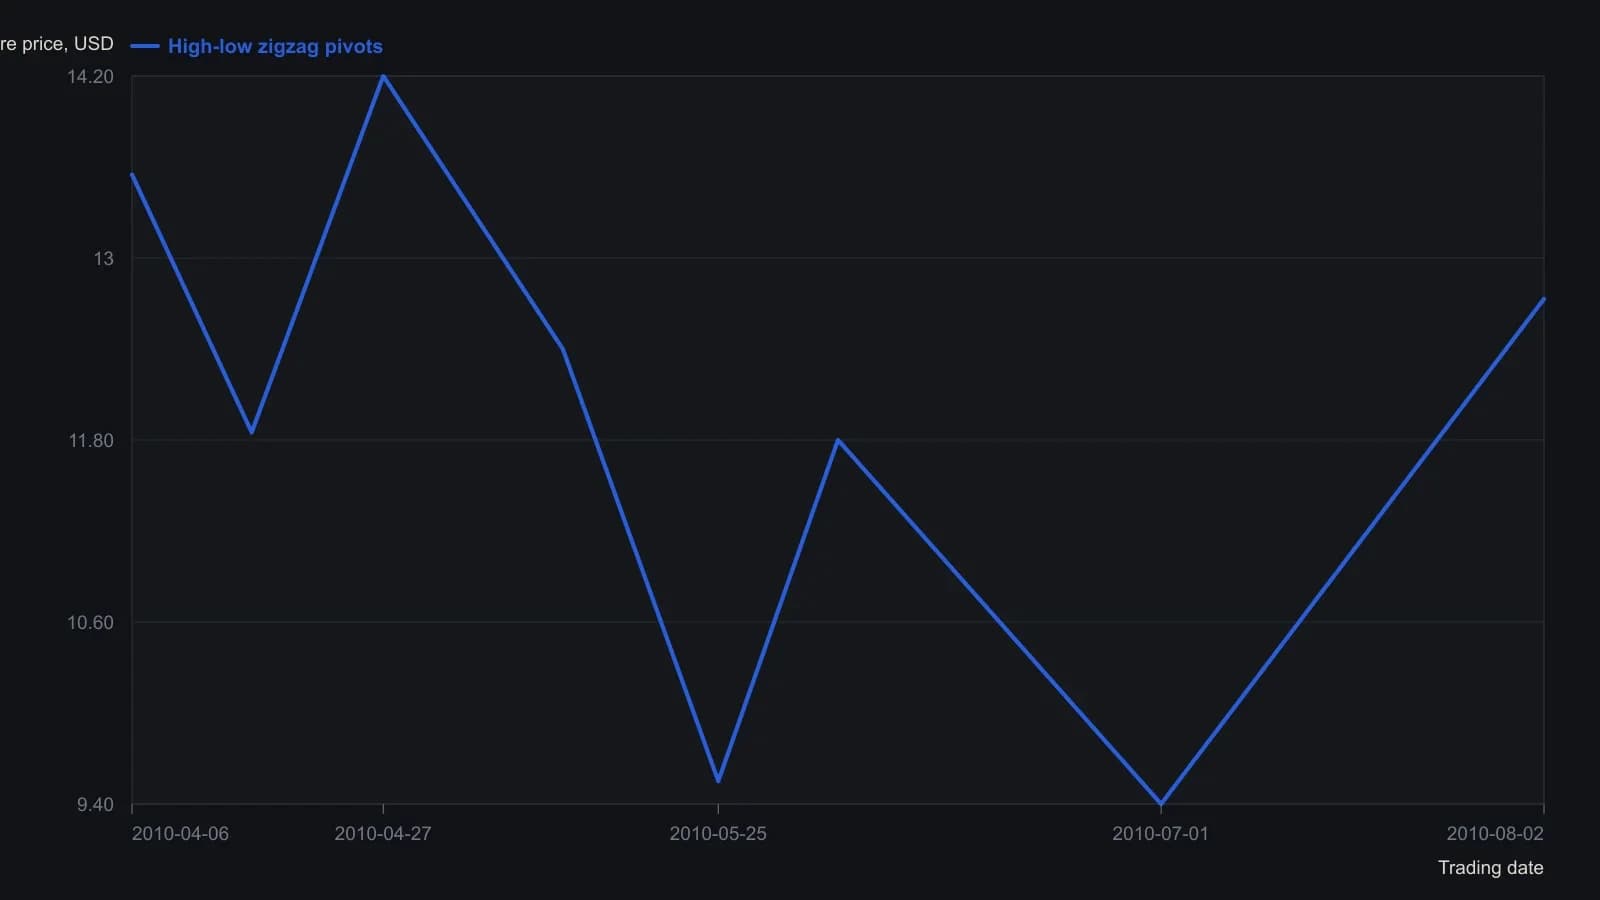
Unlabeled pivot dates are inferred from the month axis and are approximate to a few sessions. Prices other than the printed 12.73 close were read from a 0.50-dollar grid and rounded to the nearest 0.05. The figure does not print the ZZPercent, ATRPeriod, or ATRFactor values used for these turns.
All readings on this track · 36 readings
- 1988Constructing unsigned true range for directional models
- 1989Evaluate an always-in ATR breakout as one procedure
- 1992Variable lookback and average true range as a trend-filter construction
- 1993A random-walk index that uses true range as its scale
- 1993A shared harness for trend-filter construction
- 1998Finish a trend with a volatility trail, wave permission, and a slower-frame veto
- 1999A trend filter that switches tactics and scales ATR targets
- 2001Filter higher lows with linear regression, then judge the exit
- 2003A Mechanical trading system is a maintained procedure, not only an entry trigger
- 2005Construction of a volatility-bounded long entry
- 2005Six-zone encoding of open, high, low, and close
- 2006Normalized average true range as a pre-entry volatility bound
- 2006Chandelier exits, ATR position sizing, and trailing stops
- 2007Constructing a rule-based entry with Relative Strength Index and ATR position sizing
- 2008Constructing a zero-lag TMA and heikin-ashi crossover as a complete rule set
- 2010Use the session-range percent stop as a pre-trade filter
- 2011OCA exit groups, trailing limits, and ATR stops
- 2011ATR bands around support and resistance for stops and targets
- 2013Algorithmic head-and-shoulders construction with bounded exits
- 2013Constructing ATR-scaled swing pivots and linear-regression divergence
- 2013Constructing volatility bands from typical price
- 2014Constructing true-range contraction filters before expansion
- 2015Constructing touch plans from modified true range
- 2015One checklist for breakout entry and ATR risk
- 2015Percentage true-range construction for cross-market volatility filters
- 2015Construct a percentage true range for cross-market volatility
- 2015Percentage true range as a pre-entry exposure filter
- 2016Constructing ATR-filtered breakout entries
- 2017A dividend date as a pairs-trading classroom
- 2018Range-based volatility as a true-range construction
- 2018Moving average support and volatility-band construction
- 2018Construct a lifecycle breakout from compression
- 2018Pair the book first and let volatility or range set the size
- 2019Trend systems need a no-trade rule
- 2020Average true range as a shared unit for size, pairs, and stops
- 2020Volatility sizing and target-risk leverage as a pre-trade gate