2013issue C0859-62
Constructing volatility bands from typical price
This archive article reconstructs a volatility envelope from typical price, an 8-period exponential midline, and an asymmetric deviation pair. Long and short rules enter on a band close, hold relative to the midline, and place the Stop-loss order on the opposite band.
- The envelope uses typical price as the source, an 8-period exponential average as the midline, a 13-period summed increment scaled by a 3.55 deviation factor as the upper offset, and a 0.9 multiplier on that offset for the lower band.
- Typical-price increments are path-dependent: current typical price minus prior low when typical price is at or above the prior typical price, otherwise prior typical price minus current low.
- The long construction enters on a close above the upper band, holds while price remains largely above the midline, and treats the lower band as the Stop-loss order. The short construction is the inverse, with the upper band as the Stop-loss order.
- A sample reverse-on-band-close system places the initial stop at the opposite volatility band and sizes each order with a fixed-fractional money-management block. A deviation factor of 1 is a tighter trigger that still uses the far band as the stop.
What the envelope is built from
The volatility envelope uses typical price as the source series. An 8-period exponential average is the midline. The upper offset is a 13-period summed increment scaled by a 3.55 deviation factor. The lower band applies a 0.9 multiplier to that same offset, so the pair is asymmetric.
The increment that feeds the offset depends on the path of typical price from one bar to the next, not on a single bar range taken in isolation.
Path-dependent typical-price increments
When typical price is at or above the prior typical price, the increment is current typical price minus the prior low. Otherwise the increment is prior typical price minus the current low.
Those increments are summed over 13 periods and scaled by the 3.55 deviation factor to form the upper offset. The lower band is not a separate increment series. It is that offset multiplied by 0.9.
Withholding the plot during warmup
One platform withholds the plotted bands until the bar count exceeds three times the average length plus twice the volatility lookback. The envelope is not drawn during that unstable warmup window.
Entries, holds, and opposite-band stops
The long construction enters on a close above the upper band. It holds while price remains largely above the midline. It treats the lower band as the Stop-loss order.
The short construction is the inverse, with the upper band as the Stop-loss order.
A sample reverse-on-band-close system places the initial stop at the opposite volatility band and sizes each order with a fixed-fractional money-management block.
A tighter trigger on the same stop
A tighter deviation factor of 1 is presented as a trigger setting that still uses the far band as the Stop-loss order rather than as an entry envelope.
Editorial interpretation: the fixed-fractional money-management block is the slot where ATR position sizing can scale the order once that opposite-band Stop-loss order is known. That reading is from TradersWeek, not from the archive.
Soybean long from a volatility-band break
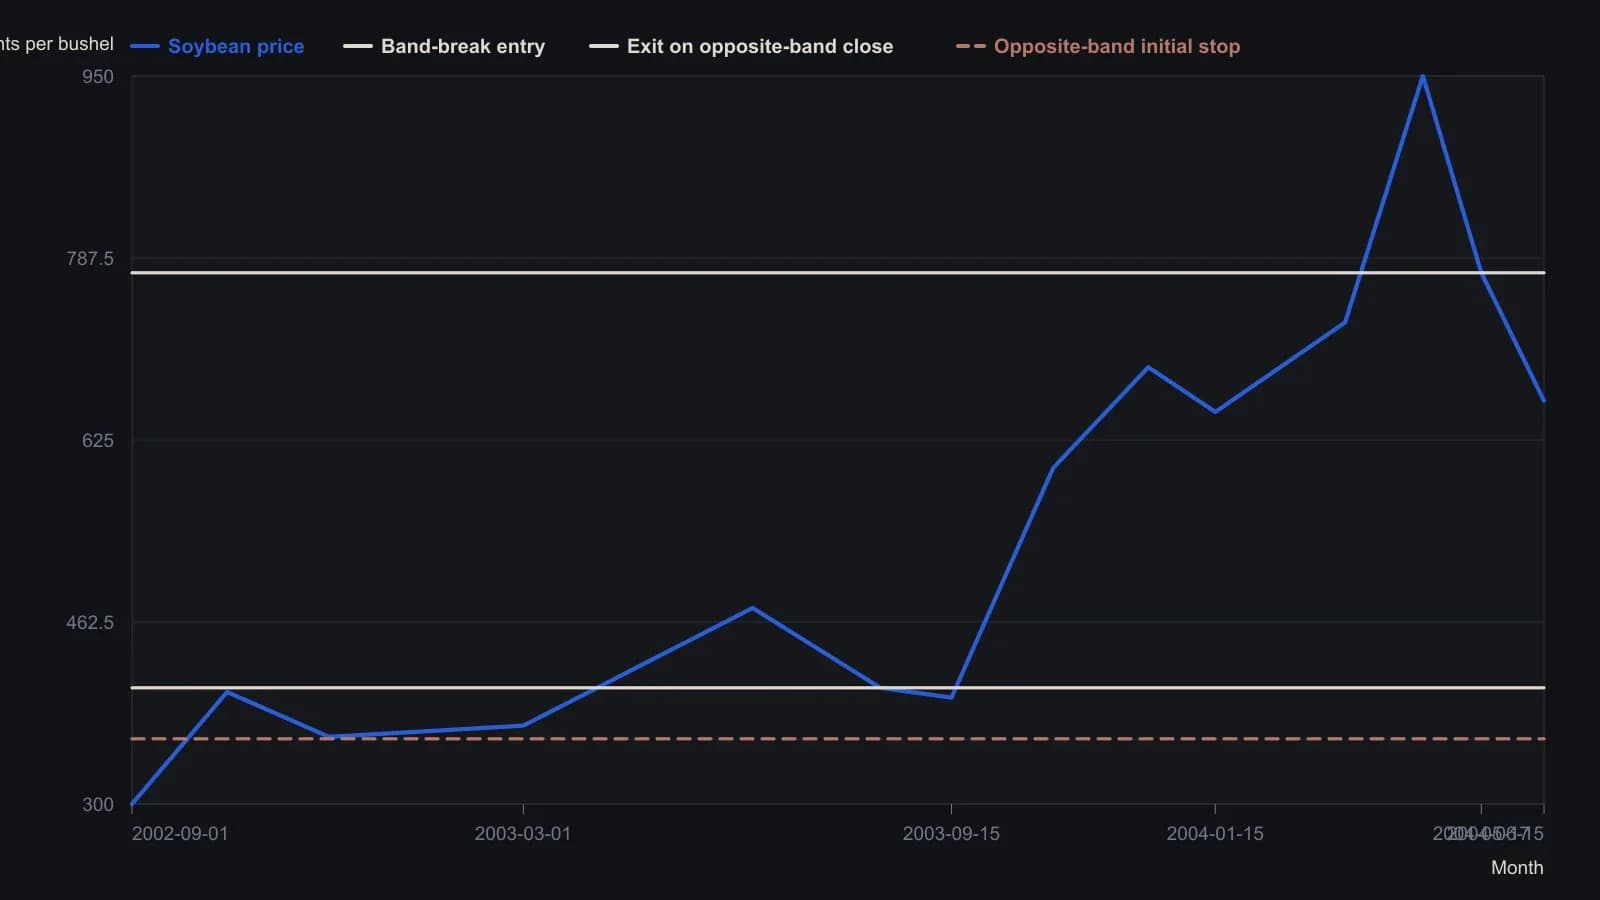
Daily CBT soybeans, combined session. Long on a close above the upper band, reverse when the close crosses the lower band. Digitized price points other than the three printed labels are visual readings, rounded to the nearest five cents.
All readings on this track · 36 readings
- 1988Constructing unsigned true range for directional models
- 1989Evaluate an always-in ATR breakout as one procedure
- 1992Variable lookback and average true range as a trend-filter construction
- 1993A random-walk index that uses true range as its scale
- 1993A shared harness for trend-filter construction
- 1998Finish a trend with a volatility trail, wave permission, and a slower-frame veto
- 1999A trend filter that switches tactics and scales ATR targets
- 2001Filter higher lows with linear regression, then judge the exit
- 2003A Mechanical trading system is a maintained procedure, not only an entry trigger
- 2005Construction of a volatility-bounded long entry
- 2005Six-zone encoding of open, high, low, and close
- 2006Normalized average true range as a pre-entry volatility bound
- 2006Chandelier exits, ATR position sizing, and trailing stops
- 2007Constructing a rule-based entry with Relative Strength Index and ATR position sizing
- 2008Constructing a zero-lag TMA and heikin-ashi crossover as a complete rule set
- 2010Use the session-range percent stop as a pre-trade filter
- 2011OCA exit groups, trailing limits, and ATR stops
- 2011ATR bands around support and resistance for stops and targets
- 2013Algorithmic head-and-shoulders construction with bounded exits
- 2013Constructing ATR-scaled swing pivots and linear-regression divergence
- 2013Constructing volatility bands from typical price
- 2014Constructing true-range contraction filters before expansion
- 2015Constructing touch plans from modified true range
- 2015One checklist for breakout entry and ATR risk
- 2015Percentage true-range construction for cross-market volatility filters
- 2015Construct a percentage true range for cross-market volatility
- 2015Percentage true range as a pre-entry exposure filter
- 2016Constructing ATR-filtered breakout entries
- 2017A dividend date as a pairs-trading classroom
- 2018Range-based volatility as a true-range construction
- 2018Moving average support and volatility-band construction
- 2018Construct a lifecycle breakout from compression
- 2018Pair the book first and let volatility or range set the size
- 2019Trend systems need a no-trade rule
- 2020Average true range as a shared unit for size, pairs, and stops
- 2020Volatility sizing and target-risk leverage as a pre-trade gate