2003issue C111-5
Constructing an expiration settlement map from listed open interest
Listed open interest records only contracts that remain open. Turning that book into a settlement-cost curve maps the low-cost expiration print for a cash-settled index. The map is a construction of the listed series, used to read why the underlying can be pulled toward that print.
- Open interest counts only contracts that remain open. It rises when a new long and a new short are created together and falls when both sides close.
- Settlement-cost at each candidate print is the cash due on every in-the-money strike. The minimum of that curve is the optimum expiration price for the listed book.
- As expiration approached, the underlying was described as tending toward that low-settlement-cost print, where most listed options typically expired out of the money.
- A five-day open-interest index, and the same series recast as a 0-to-100 oscillator, was used to judge whether settlement was likely above or below the live print.
What open interest records
Open interest counts only contracts that remain open. It rises when a new long and a new short are created together and falls when both sides close. Each listed unit pairs one long with one short.
That remaining book is the raw material for an expiration-day map. The construction below turns the listed series into a settlement-cost curve and then compares that curve with the live index.
How settlement price is formed
On the illustrated cash-settled index, settlement price was formed by averaging 31 one-minute samples between 15:30 and 16:00. That late-session span is the expiration period, the short window when settlement of cash-settled index options is determined from sampled underlying prints.
The expiration window showed elevated activity. The samples in that window, not a single last print, are what the listed book is settled against.
Why quarterly months carry more open interest
January, April, July, and especially October typically carried higher open interest. Longer-term and multiyear series expired in those quarterly expiration months, and nearby price swings were larger.
A denser book means more strikes contribute cash to the settlement-cost curve. The map is built from that larger set of open contracts.
Delta-neutral hedges into expiration
Professional books were required to stay hedged the same day. They used opposite underlying trades for long and short calls and puts so that each option remained approximately delta-neutral. A delta-neutral hedge is an offsetting stock or futures position sized so that a small move in the underlying leaves the combined option-plus-hedge book approximately unchanged.
Call delta was described as ranging from 0 to 1 and put delta from 0 to -1. The hedge share count had to be revised as those ratios changed through the life of the option.
Hedging a short call and a short put together need not leave the combined book flat. One worked example bought 50 shares against the call, sold 75 against the put, and still showed a net loss of 100 after a 2-point rise. Editorial. Residual exposure of that kind is one reason the listed book still has a cash interest in where settlement price prints.
Building the settlement-cost curve
At expiration, in-the-money cash-settled index options transfer value from shorts to longs. A 350 put with open interest 662 against a 340 settlement implied 662000 of cash due on that strike alone. That cash is settlement-cost. It is computed from strike, settlement print, open interest, and contract multiplier.
Summing that cash across every in-the-money strike for many candidate prints produced a settlement-cost curve. The minimum, about 340 in the illustrated month, was treated as the market-wide optimum expiration price. The optimum expiration price is the candidate settlement level at which the sum of cash due across in-the-money strikes is minimized for the listed open-interest book.
AEX listed open interest by strike
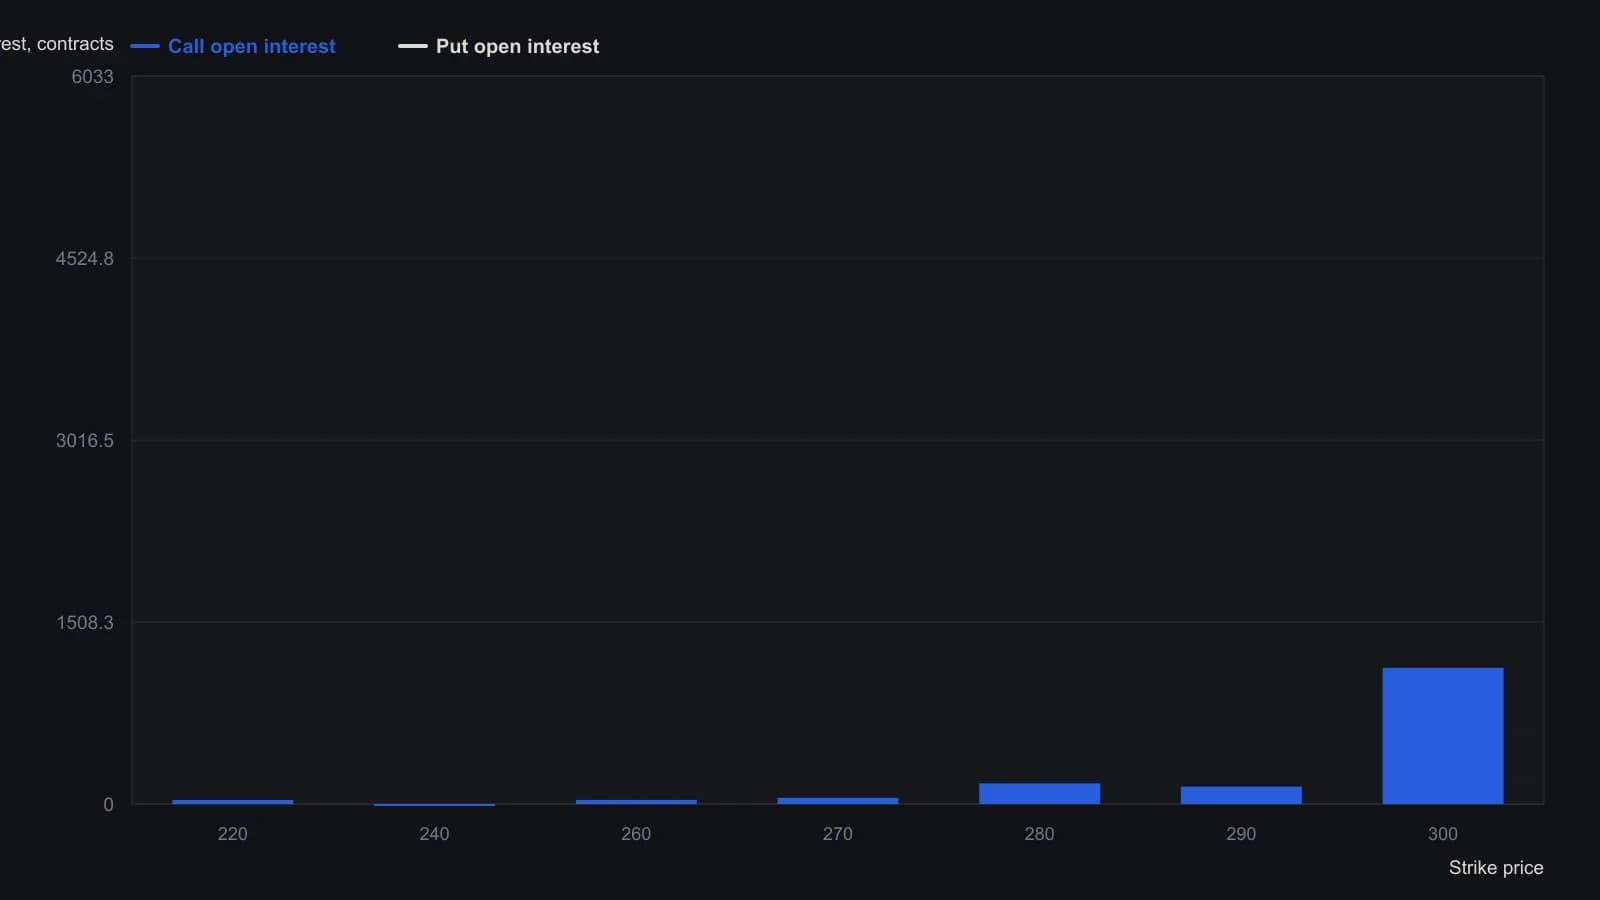
The source worksheet fixes the expiration print at 340 and lists strikes only through 300. Put settlement at every listed strike is zero because those puts expire out of the money.
Reading the open-interest index
As expiration approached, the underlying was described as tending toward that low-settlement-cost print. That level is where most listed options typically expired out of the money.
A five-day open-interest index compared with the live market, and the same series recast as a 0-to-100 oscillator, was used to judge whether settlement was likely above or below the current print. The open-interest index is the constructed series that locates the low-settlement-cost expiration level implied by current open interest.
Editorial. The comparison is a reading of the constructed map against the live index. It does not turn the map into a standalone directional call.
All readings on this track · 20 readings
- 1988Wave-count consensus and open-interest confirmation
- 1990Calibrating volume and open interest at support and resistance
- 1997Grading volume and open interest after moving-average crosses
- 2003Constructing an expiration settlement map from listed open interest
- 2010Futures liquidity filter for equal-dollar size and open interest
- 2010Screen futures for tradeable liquidity before sizing
- 2011Screen futures liquidity with open interest and equal dollar size
- 2011Construct a daily initiator filter from lead-contract price, open interest, and volume
- 2012Ranking futures markets by executable liquidity
- 2013Equal-dollar open interest as a futures liquidity filter
- 2013Filter futures by open interest and relative liquidity
- 2015Filter futures contracts by open interest and volume
- 2015Screen listed futures for executable liquidity first
- 2015Money-flow lookback versus aggregated open interest
- 2016Ranking futures by executable liquidity and open interest
- 2018Futures liquidity and open interest as an execution filter
- 2019Evaluate futures liquidity with open interest and equal-dollar filters
- 2019Screen futures contracts by open interest and liquidity
- 2020Filter futures orders by liquidity and open interest
- 2020Ranking futures liquidity before you place the order