2020issue C0758
Filter futures orders by liquidity and open interest
The archive ranks listed futures by fill capacity, using a same-dollar contract count, open interest, and a volume factor, then states margin against a three-year dollar range. Editorial view: treat the watchlist as an execution queue and drop thin books before any directional size is chosen.
- A liquidity filter ranks or excludes listed markets by how executable an order is, using activity, capacity, and cost, not a directional forecast.
- Relative contract liquidity multiplies an equal-dollar contract count by total open interest and a volume factor that up-weights active books.
- Effective percent margin states initial margin against the contract’s three-year dollar price range so locked capital is compared on a common range.
- Each column is a proportional measure and is meaningful only against other markets in the same column; listings with one or no activity marks are weaker fill candidates.
Screen the book before the view
A liquidity filter is a pre-trade screen that ranks or excludes listed markets by how executable an order is. It uses activity, capacity, and cost inputs rather than a directional forecast.
Open interest analysis uses the stock of outstanding futures as a capacity input when judging whether a market can absorb size across the life of an order.
Listings with one or no activity marks are treated as thinly traded and therefore weaker candidates when an order must be filled.
How relative contract liquidity is built
A futures liquidity ranking is produced by multiplying contract point value, a three-year maximum price move, open interest, and a volume factor.
Relative contract liquidity is the equal-dollar contract count times total open interest times the volume factor. It is a cross-market ranking of how readily a listed futures book can be bought or sold.
The equal-dollar contract count equals tick dollar value times the three-year maximum price excursion, so every listed market is scaled to a common dollar range. It states how many contracts of one market are needed to match another market’s multi-year dollar price range.
The volume factor up-weights actively traded listings and down-weights thin ones. It is described as usually ranging from 1 to 4 according to whether volumes are low or high, or as the greater of 1 and the exponential of the natural log of volume divided by the natural log of 5000, minus 2.
Compare capital lock on a common range
Effective percent margin equals dollar margin divided by the three-year range of contract dollar value, then multiplied by 100. Initial margin is stated as a percentage of the contract’s three-year dollar price range rather than of face value, so capital locked is compared on a like-for-like range basis.
Read each column only against its peers
Each column is a proportional measure and is meaningful only when compared with other markets in the same column.
For equities, period volume as a percentage of shares outstanding is presented as share turnover, a turnover-rate proxy for trading liquidity.
Percent margin versus effective percent margin on listed futures
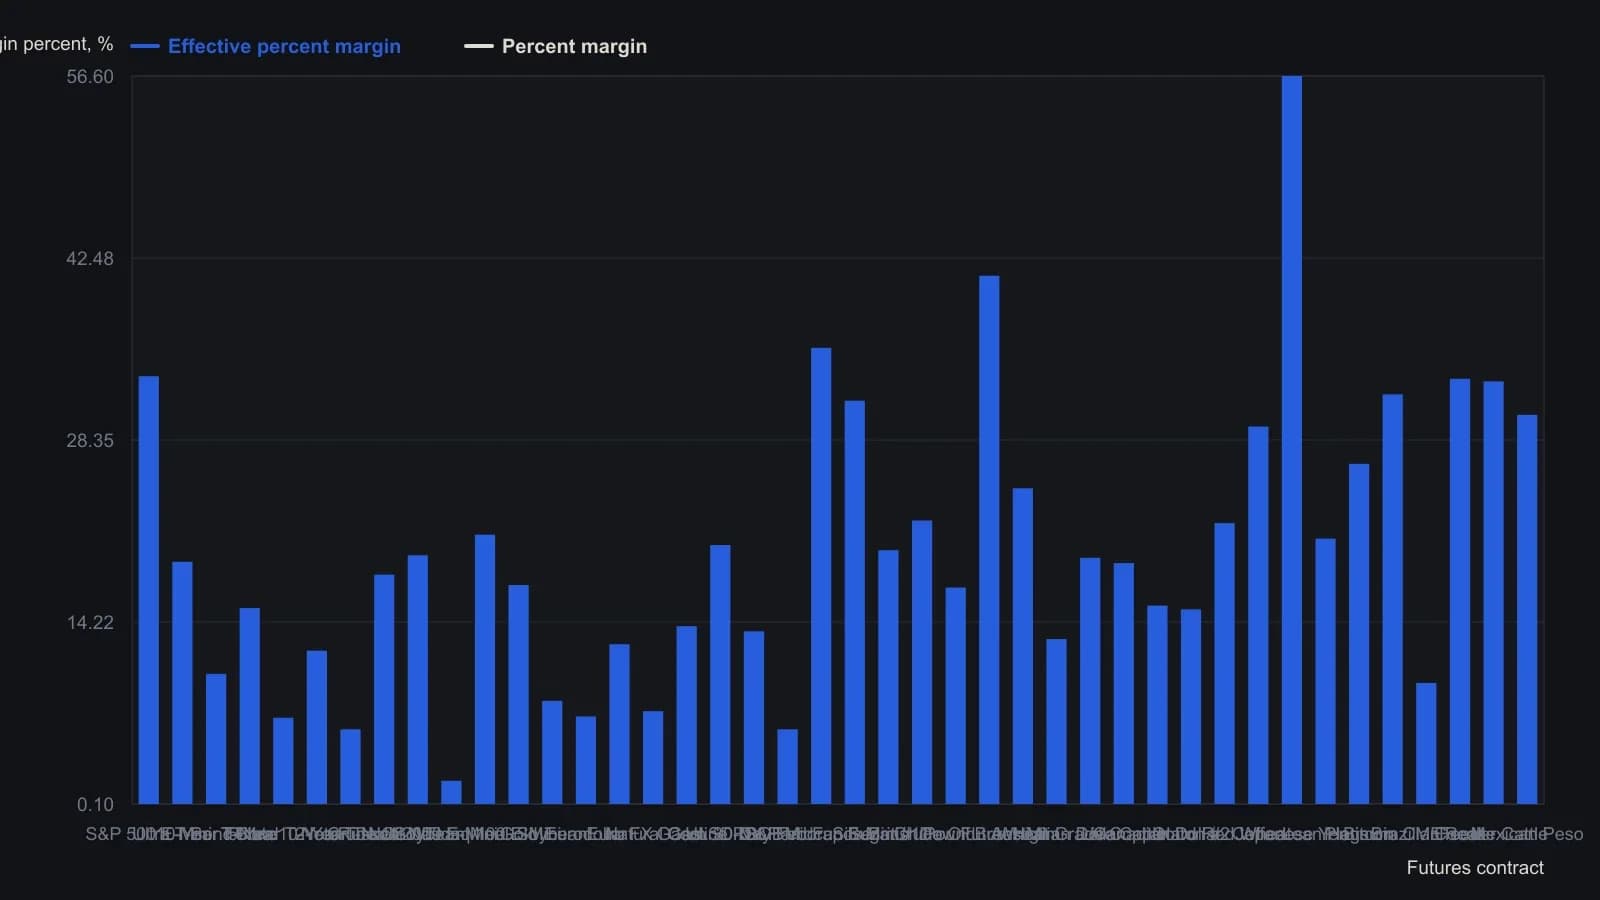
Effective percent margin is dollar margin divided by the three-year dollar range of the contract, times 100. Rows follow the source liquidity ranking, not the margin values. Relative contract liquidity is printed only as a dot scale and is not plotted.
All readings on this track · 20 readings
- 1988Wave-count consensus and open-interest confirmation
- 1990Calibrating volume and open interest at support and resistance
- 1997Grading volume and open interest after moving-average crosses
- 2003Constructing an expiration settlement map from listed open interest
- 2010Futures liquidity filter for equal-dollar size and open interest
- 2010Screen futures for tradeable liquidity before sizing
- 2011Screen futures liquidity with open interest and equal dollar size
- 2011Construct a daily initiator filter from lead-contract price, open interest, and volume
- 2012Ranking futures markets by executable liquidity
- 2013Equal-dollar open interest as a futures liquidity filter
- 2013Filter futures by open interest and relative liquidity
- 2015Filter futures contracts by open interest and volume
- 2015Screen listed futures for executable liquidity first
- 2015Money-flow lookback versus aggregated open interest
- 2016Ranking futures by executable liquidity and open interest
- 2018Futures liquidity and open interest as an execution filter
- 2019Evaluate futures liquidity with open interest and equal-dollar filters
- 2019Screen futures contracts by open interest and liquidity
- 2020Filter futures orders by liquidity and open interest
- 2020Ranking futures liquidity before you place the order