1997issue C101-4
Grading volume and open interest after moving-average crosses
A close through a moving average can mark a pause inside the prior trend or the start of a reversal. The last completed swing is graded on average daily volume and open-interest growth so a later recross can be classified as a correction or a reversal.
- A close through a moving average does not classify the move, because the same cross can mark a pause inside the prior trend or the start of a reversal.
- A 13-day moving average timestamps reactionary lows and highs so an advance or a decline can be measured for swing volume and open-interest growth.
- A swing is graded strong when both average daily volume and open-interest growth exceed those of 70 of 100 randomly selected swings from the prior 10 years, graded weak when both sit below 70 percent of that sample, and otherwise graded as neither.
- In the archive workflow, a later close back through the average was classified as a correction after a strong decline and would have been classified as a reversal after a weak decline.
The cross does not classify the move
After a close through a moving average, the same cross can mark either a pause inside the prior trend or the start of a reversal. The cross by itself does not classify the move.
How the average ends a swing
A 13-day moving average marks reactionary lows and highs. A close above the average names the lowest price from the period below the average as a reactionary low. A close below the average names the highest price from the period above the average as a reactionary high.
An advance is the path from a reactionary low to the next reactionary high, and a decline is the path from a reactionary high to the next reactionary low. Swing volume is the average daily volume over that path, and open-interest growth is the largest increase recorded on that path.
In this workflow a moving average is a lookback average of ordered closes that timestamps reactionary highs and lows and marks when a defined swing has ended.
Volume and open interest
Average trading volume during a price swing is treated as a measure of how much new information is being discounted. Larger volume is read as a stronger force that is more likely to reappear later.
Open interest rises when a new long and a new short are created together. A larger open-interest increase during a swing is treated as a stronger force that is more likely to reappear later.
Volume-price analysis compares a swing's average daily volume with a historical sample of swings so a charted price break can become a checkable continuation-or-reversal hypothesis. Open-interest analysis measures the largest open-interest increase during a defined swing and ranks that expansion before a continuation or reversal plan is chosen.
The swing strength grade
A swing is graded strong when both its average daily volume and its open-interest growth exceed those of 70 of 100 randomly selected swings from the prior 10 years. A swing is graded weak when both sit below 70 percent of that sample. Otherwise the swing is graded as neither.
That three-way label is the swing strength grade.
A strong decline classified as a correction
In the Treasury bond decline from a 116-12 close on 3 December 1996 to a 112-14 trough on 18 December, average daily volume of 411967 contracts and open-interest growth of 22135 contracts both exceeded the sample cutoffs of 339000 contracts and a 16750-contract open-interest increase. The later close back above the 13-day average was classified as a correction.
A weak decline classified as a reversal
If that same decline had posted volume of 222222 contracts and open-interest growth of 4444 contracts, both figures would have fallen below the matching sample cutoffs of 258000 contracts and a 5100-contract open-interest increase. The close back above the average would have been classified as a reversal.
T-bond daily close and 13-day average, November–December 1996
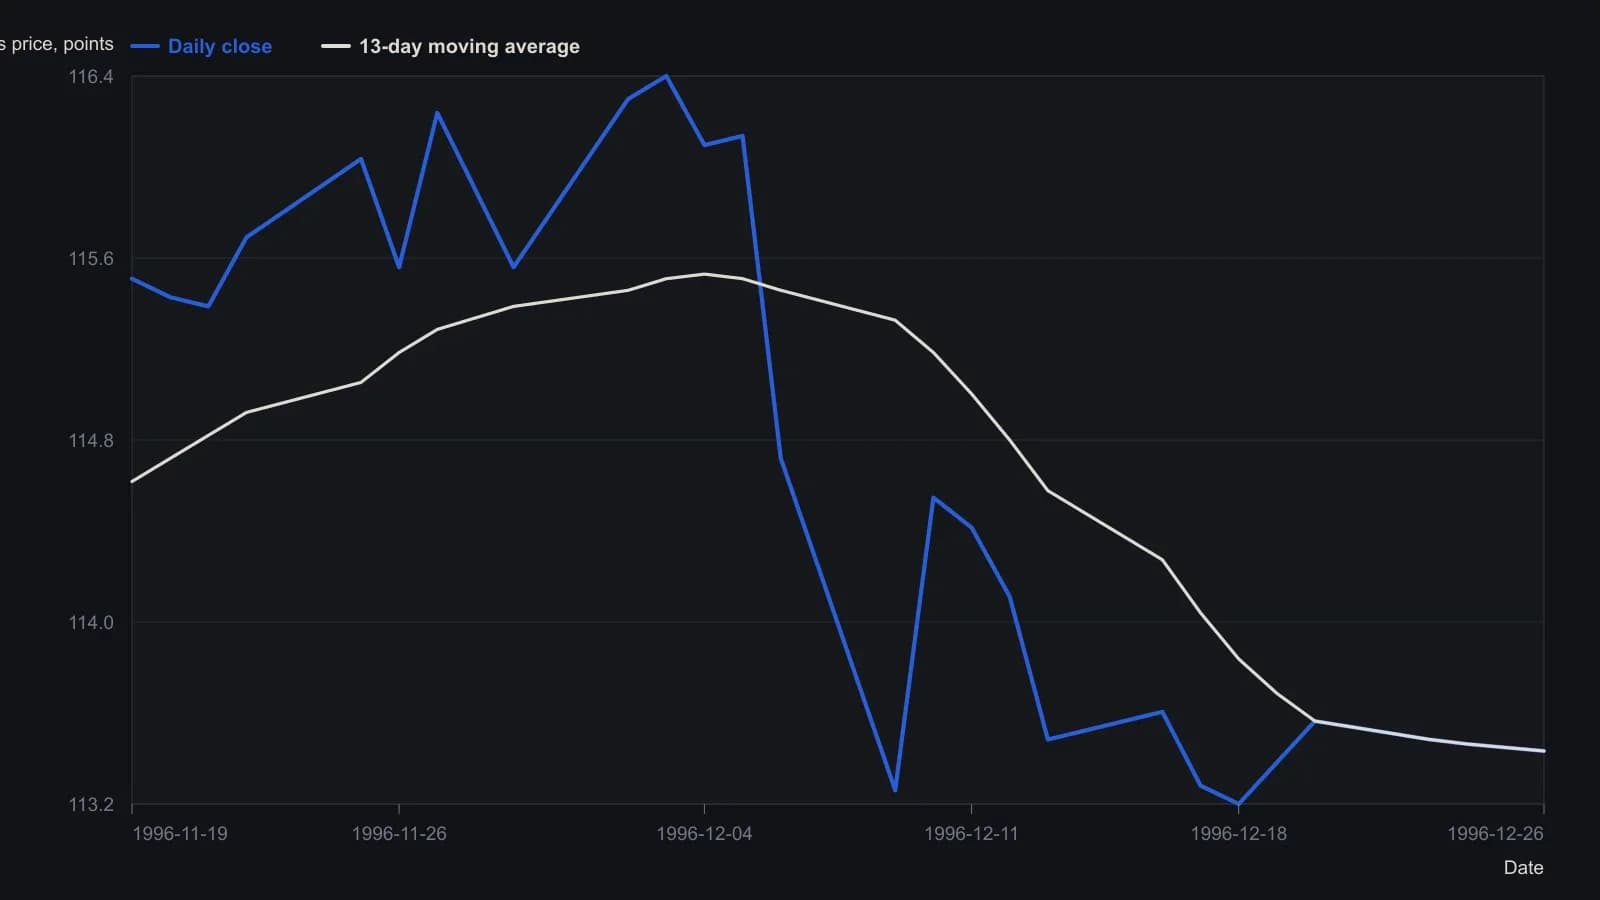
The source uses a 13-day moving average to mark reactionary highs and lows. Prices are approximate raster readings in decimal points (116-12 equals 116.375). The printed scale is CQG 32nds notation from 113-00 to 117-00, so the 112-14 trough named in the text sits below the lowest grid and is not plotted.
All readings on this track · 20 readings
- 1988Wave-count consensus and open-interest confirmation
- 1990Calibrating volume and open interest at support and resistance
- 1997Grading volume and open interest after moving-average crosses
- 2003Constructing an expiration settlement map from listed open interest
- 2010Futures liquidity filter for equal-dollar size and open interest
- 2010Screen futures for tradeable liquidity before sizing
- 2011Screen futures liquidity with open interest and equal dollar size
- 2011Construct a daily initiator filter from lead-contract price, open interest, and volume
- 2012Ranking futures markets by executable liquidity
- 2013Equal-dollar open interest as a futures liquidity filter
- 2013Filter futures by open interest and relative liquidity
- 2015Filter futures contracts by open interest and volume
- 2015Screen listed futures for executable liquidity first
- 2015Money-flow lookback versus aggregated open interest
- 2016Ranking futures by executable liquidity and open interest
- 2018Futures liquidity and open interest as an execution filter
- 2019Evaluate futures liquidity with open interest and equal-dollar filters
- 2019Screen futures contracts by open interest and liquidity
- 2020Filter futures orders by liquidity and open interest
- 2020Ranking futures liquidity before you place the order