2020issue C1258
Ranking futures liquidity before you place the order
A futures book can be ranked for relative-contract-liquidity before an order is sent by combining contract point value, a multi-year maximum price move, open interest, and a volume-factor. Equal-dollar contract counts and effective-percent-margin then let markets be compared on size and capital use.
- Relative-contract-liquidity ranks how easily a futures market can be traded by combining contract size, open-interest, and a volume-factor so thinner books sit lower.
- Contracts-to-trade-for-equal-dollar-profit converts each market into a contract count so comparisons are not biased by tick size.
- Effective-percent-margin divides margin dollars by the three-year dollar range of the contract so capital use can be compared across markets.
- Markets at the top of a relative-liquidity list are framed as easier to buy and sell, while markets at the bottom are framed as the most difficult to trade.
A futures liquidity ranking can be built by combining contract point value, a multi-year maximum price move, open interest, and a volume-factor that typically ranges from 1 to 4.
How the relative-liquidity score is built
The relative-liquidity score is the equal-dollar contract count times total open interest times a volume-factor equal to the greater of 1 or exp(ln(volume)/ln(5000) - 2). Open-interest is the outstanding futures positions used as a stock of liquidity when ranking how much size the market can absorb. The volume-factor is a multiplier, often between one and four, that down-weights markets with low recent volume so a large open-interest figure is not mistaken for an executable book. Relative-contract-liquidity is the resulting ranking of how easily a futures market can be traded, so thinner books sit lower.
Compare markets on equal dollars
Equal-dollar comparison requires converting each market into a contract count: tick dollar value multiplied by the three-year maximum price excursion. Contracts-to-trade-for-equal-dollar-profit is that contract count, the number needed in one market to match another market's three-year dollar price range, so comparisons are not biased by tick size. Effective-percent-margin is margin dollars divided by the three-year dollar range of the contract, then multiplied by one hundred, so capital use can be compared across markets.
Read the scale, not a standalone number
Relative liquidity can be shown as a descending visual scale so markets with the densest marks are treated as more executable than markets with one mark or none. Markets at the top of a relative-liquidity list are framed as easier to buy and sell, while markets at the bottom are framed as the most difficult to trade. Column values in such a ranking are proportional and are only meaningful when compared with other markets in the same column.
Share turnover as a stock-market proxy
Share turnover, period volume as a percent of shares outstanding, can be used as a stock-market proxy for trading liquidity and for how activity may relate to price change.
Equal-dollar futures contract counts
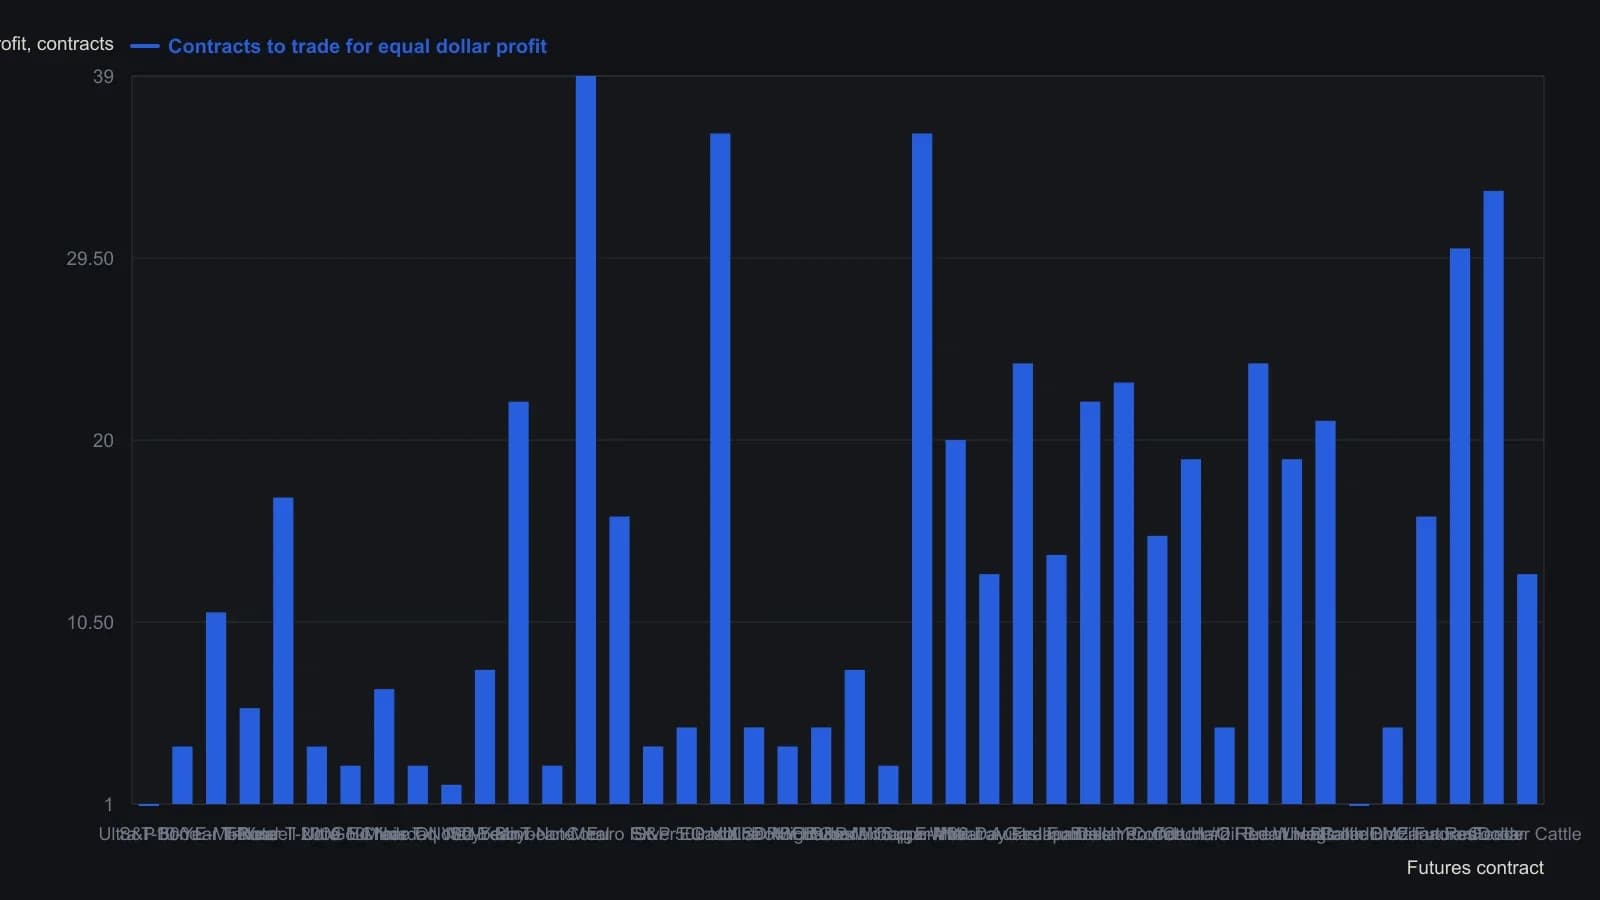
The source defines the count as tick dollar value times the three-year maximum price excursion, so every bar is the same dollar potential. Row order follows relative contract liquidity, not this count.
All readings on this track · 20 readings
- 1988Wave-count consensus and open-interest confirmation
- 1990Calibrating volume and open interest at support and resistance
- 1997Grading volume and open interest after moving-average crosses
- 2003Constructing an expiration settlement map from listed open interest
- 2010Futures liquidity filter for equal-dollar size and open interest
- 2010Screen futures for tradeable liquidity before sizing
- 2011Screen futures liquidity with open interest and equal dollar size
- 2011Construct a daily initiator filter from lead-contract price, open interest, and volume
- 2012Ranking futures markets by executable liquidity
- 2013Equal-dollar open interest as a futures liquidity filter
- 2013Filter futures by open interest and relative liquidity
- 2015Filter futures contracts by open interest and volume
- 2015Screen listed futures for executable liquidity first
- 2015Money-flow lookback versus aggregated open interest
- 2016Ranking futures by executable liquidity and open interest
- 2018Futures liquidity and open interest as an execution filter
- 2019Evaluate futures liquidity with open interest and equal-dollar filters
- 2019Screen futures contracts by open interest and liquidity
- 2020Filter futures orders by liquidity and open interest
- 2020Ranking futures liquidity before you place the order