2020issue C1254-55
Mechanical Parabolic SAR as an always-in flip after a breakout
A historical daily-chart case applied a price-and-time stop-and-reverse overlay to a video-communications listing after an early-2020 base and a February 2020 breakout. The archive shows continuous long and short marks and a first-session flip rule. Editorial reading treats that rule as one always-in procedure, then uses the post-breakout tape only to ask when the procedure is eligible to be tested.
- The overlay is a trend-following, price-and-time stop-and-reverse construction that keeps a continuous long or short stance.
- A long stance is indicated while the marker sits below price, and a short stance while it sits above; the new side is taken on the first session of a switch.
- Mechanical adherence means taking each flip as specified, without discretionary override, until the next reverse.
- The originator estimated that securities trend about 30 percent of the time, so the overlay is framed for instruments already in a directional regime.
A continuous stop-and-reverse stance
The overlay is a trend-following, price-and-time stop-and-reverse construction that keeps a stance continuously long or short. Parabolic SAR trails the market and changes side when price crosses the stop.
A long stance is indicated while the marker sits below price, and a short stance is indicated while the marker sits above price. Under the stop-and-reverse rule, an exit immediately opens the opposite side so the book is never flat. The always-in stance is that continuous long or short posture, held until the overlay flips.
How a flip is taken
The illustrated procedure takes the new side on the first session of an up-to-down or down-to-up switch and holds until the next reverse. That flip session is the first bar after the overlay switches from below price to above it, or the reverse.
Mechanical adherence means following each flip as specified rather than overriding the sequence by discretion. The illustration used default sensitivity settings, which can be raised or lowered.
The post-breakout daily case
A daily-chart case applied the overlay to a video-communications listing after an early-2020 base and a February 2020 breakout that then printed higher highs and higher lows along an unbroken trendline.
On that post-breakout daily chart, separate marks identified long and short indications from the overlay.
Trending eligibility before a test
The originator estimated that securities trend about 30 percent of the time, so the overlay is framed as a tool for trending instruments. Trending eligibility is the precondition that the procedure is meant for instruments already in a directional regime.
Editorial reading: the post-breakout structure is used only as a check on whether a directional regime is present, not as a verdict on the overlay.
ZM daily share price after the February 2020 breakout
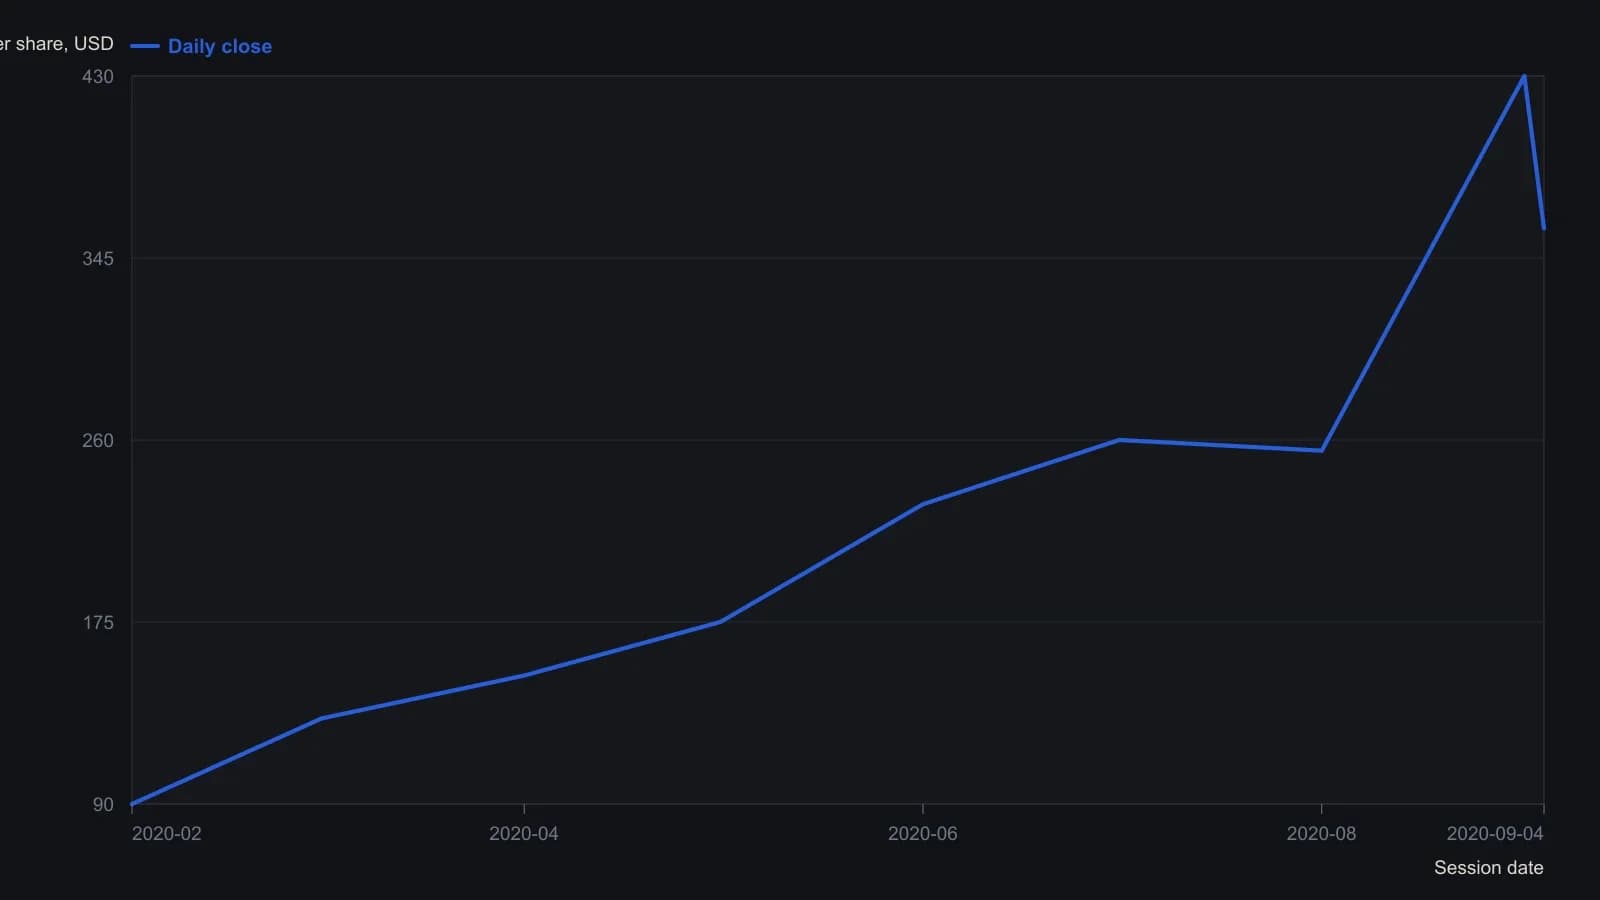
Intermediate closes are digitised to the nearest five dollars from the labelled price axis. Signal arrows are drawn on the figure, but those stop prices are not printed and are not plotted here.
All readings on this track · 21 readings
- 1987Constructing parabolic stops and cycle-window averages
- 1989Evaluating always-in parabolic SAR trailing stops
- 1993Constructing parabolic time-price trailing stops
- 1995Constructing parabolic SAR as an accelerating trail
- 1995Constructing a noise-buffered parabolic trailing stop
- 1997Constructing a parabolic trailing stop that only tightens
- 1998Triangle breakouts filtered by an exponential average and exited with parabolic stops
- 2000Treat volume-price imbalance as a hypothesis and let Parabolic SAR hold the exit
- 2002Constructing volatility stops from average true range and parabolic SAR
- 2002Parabolic SAR construction from stop outputs to reversal signals
- 2002Always-in-market SAR trail with directional confirmation
- 2004Forex trend confirmation with Average Directional Index, Parabolic SAR, and trendlines
- 2006Permission and fill gates for mechanical systems
- 2008A Relative Strength Index channel for profit lock and a trailing stop for capital protection
- 2010Building loss limits from the parabolic stop-and-reverse plot
- 2015Dual-zone currency indexes filter parabolic SAR signals
- 2016A parabolic trailing stop is not a complete system
- 2019Assigning jobs in a stochastic, parabolic, and moving-average stack
- 2019A three-filter stack as a redundancy test
- 2020Mechanical Parabolic SAR as an always-in flip after a breakout
- 2020Layering Relative Strength Index, MACD, and Parabolic SAR onto relative rotation maps