2019issue C0446-54
Assigning jobs in a stochastic, parabolic, and moving-average stack
This archive workflow assigns one job to each layer of an indicator combination: a numeric scan for the stochastic oscillator, a permission test for the parabolic mark, and either a non-trigger backdrop or an explicit adaptive-versus-baseline crossover for moving averages. Editorial reading: the stack is checkable only when those jobs stay apart.
- Scan a 12-period stochastic oscillator with one-period smoothing as a sell candidate when the reading is below 78, or when a reading above 78 has fallen below the oscillator's own three-period average.
- Run the parabolic mark with an acceleration-factor step of 0.07 and a cap of 0.20, and require that mark to sit below price on names that are held or newly bought.
- Plot simple moving averages of 8, 16, and 50 periods as a visual check, or encode an adaptive-versus-baseline crossover that can be checked out of sample.
- Adding more indicators after the first two layers need not raise the safety of holdings, and the stochastic-plus-parabolic pair does not remove the chance of a sudden downward break.
A job map for three methods
An indicator combination is a stack in which each method is assigned a distinct, testable job so the set can be checked layer by layer.
The historical workflow uses a stochastic oscillator, a parabolic SAR overlay, and a moving-average layer together. Editorial reading: treat that stack as a job map rather than as a crowded overlay, and keep each layer answering a different question.
One numeric scan
A stochastic oscillator is a bounded reading of where the close sits inside a stated high-low window, used here as a numeric scan rather than as a standalone forecast.
A 12-period stochastic oscillator with one-period smoothing can be scanned as a sell candidate when its reading is below 78, or when a reading above 78 has fallen below the oscillator's own three-period average.
One permission test
A parabolic SAR is a trailing stop-and-reverse mark that steps with price under a rising acceleration factor and can be read as a directional permission filter.
The overlay can be run with an acceleration-factor step of 0.07 and a cap of 0.20. The permission rule requires the parabolic mark to sit below price on names that are held or newly bought.
A stochastic-plus-parabolic combination does not remove the chance of a sudden downward break. It is offered only as a way to limit how long a holding stays exposed after such a break begins.
Moving averages as a backdrop
A moving average is a smoothed path of ordered closes over a stated lookback, used either as visual trend context or as an explicit crossover baseline.
Simple moving averages of 8, 16, and 50 periods can be plotted as a longer-horizon visual check of price movement without being treated as direct entry or exit triggers.
An adaptive line versus a baseline
The same moving-average slot can be given a crossover job instead of a visual backdrop. An adaptive exponential moving average is an exponential average whose update rate expands when the close is near a recent range extreme and contracts when the close is more centered in that range.
That adaptive line can be seeded with a simple average of the close over the chosen period, then updated as the prior value plus a variable rate times the gap from that prior value to the latest close.
The adaptive rate equals the ordinary exponential weight 2 divided by the period plus one, scaled by one plus a range-location factor. The range-location factor is a zero-to-one measure of how unevenly the close sits between the lookback high and the lookback low. It compares the close's distance to the lookback low with its distance to the lookback high.
Pairing an adaptive moving average with a standard exponential moving average of the close can be encoded as a next-bar market long when the adaptive line crosses above and a next-bar market short when the exponential line crosses back above.
S&P 500 daily close with a 10-period adaptive exponential average
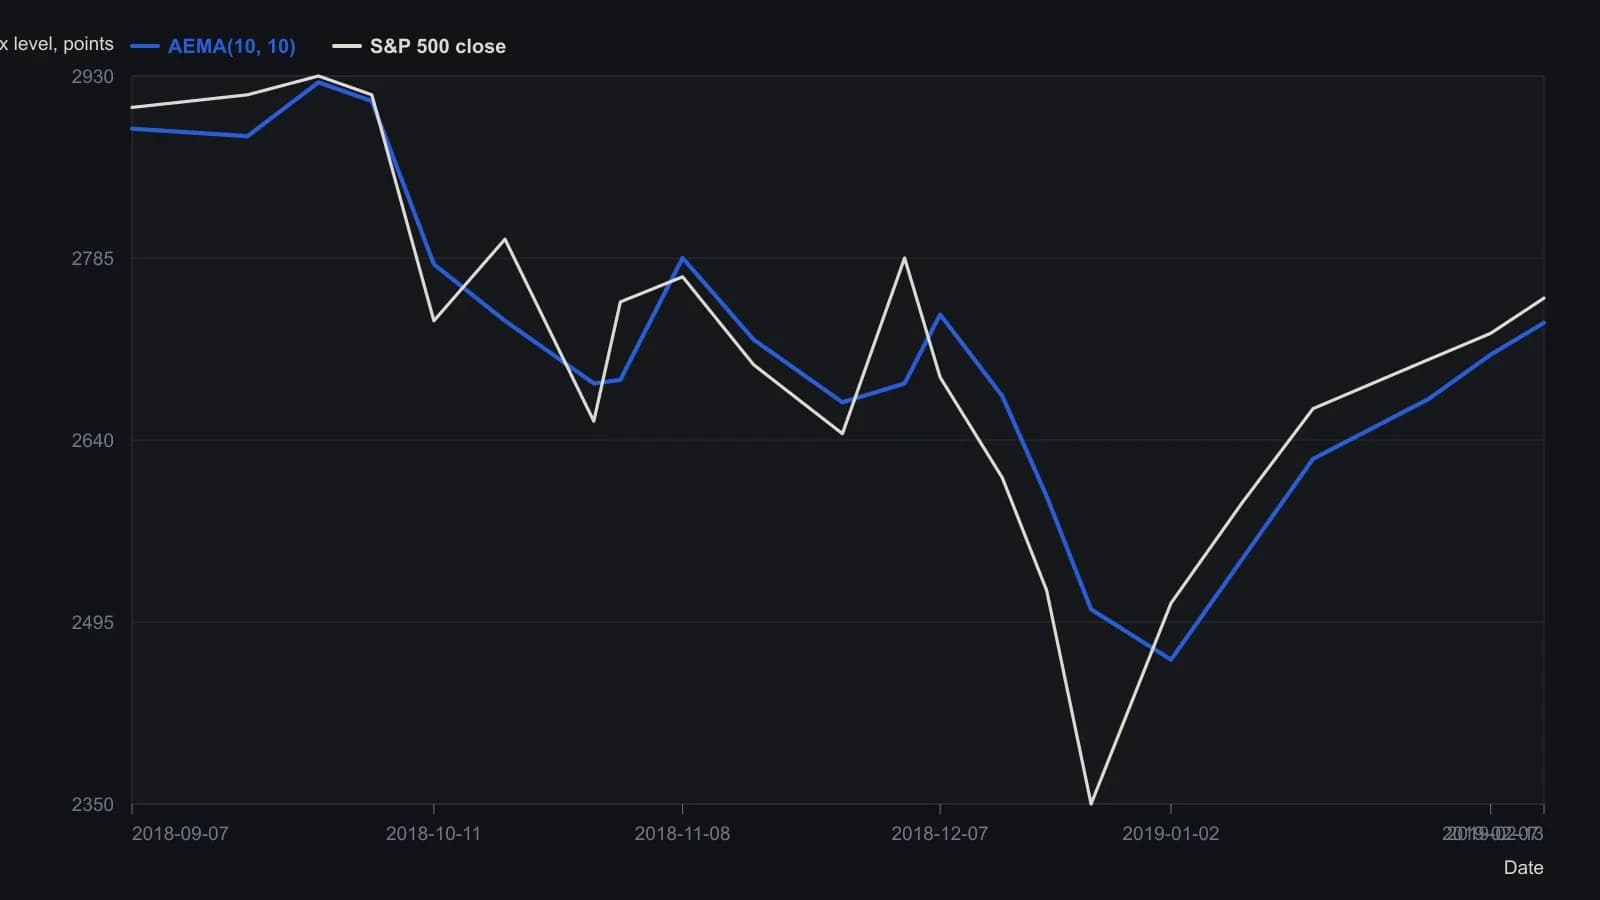
The pane titles the study Adaptive Exponential Moving Average with Period 10 and PDS 10. Digitized readings are whole-index estimates except those two labeled prints. The 31 January data box is nine daily bars before the last candle.
A double crossover with a separate exit pair
Two adaptive averages of different lengths can form a double-crossover rule. A double crossover fires when a shorter average crosses a longer average, and the exit pair need not match the entry pair.
A slower exit pair such as 20 and 100 can replace a 10-and-50 entry pair if the aim is to leave a move open longer.
The averaging period and the high-low lookback of an adaptive exponential average can be set independently. Swapping pairings such as 50-with-20 versus 20-with-50 changes the line's sensitivity. Longer 50-period pairings also produce fewer reversals than 10-period pairings on the same history.
Why the jobs stay separate
Editorial reading: the three-method stack becomes falsifiable only when the stochastic oscillator keeps the numeric scan, the parabolic mark keeps the permission test, and the moving-average layer keeps either the non-trigger backdrop or the explicit adaptive-versus-baseline crossover. If those questions collapse into one overlay, the set can no longer be checked layer by layer.
All readings on this track · 21 readings
- 1987Constructing parabolic stops and cycle-window averages
- 1989Evaluating always-in parabolic SAR trailing stops
- 1993Constructing parabolic time-price trailing stops
- 1995Constructing parabolic SAR as an accelerating trail
- 1995Constructing a noise-buffered parabolic trailing stop
- 1997Constructing a parabolic trailing stop that only tightens
- 1998Triangle breakouts filtered by an exponential average and exited with parabolic stops
- 2000Treat volume-price imbalance as a hypothesis and let Parabolic SAR hold the exit
- 2002Constructing volatility stops from average true range and parabolic SAR
- 2002Parabolic SAR construction from stop outputs to reversal signals
- 2002Always-in-market SAR trail with directional confirmation
- 2004Forex trend confirmation with Average Directional Index, Parabolic SAR, and trendlines
- 2006Permission and fill gates for mechanical systems
- 2008A Relative Strength Index channel for profit lock and a trailing stop for capital protection
- 2010Building loss limits from the parabolic stop-and-reverse plot
- 2015Dual-zone currency indexes filter parabolic SAR signals
- 2016A parabolic trailing stop is not a complete system
- 2019Assigning jobs in a stochastic, parabolic, and moving-average stack
- 2019A three-filter stack as a redundancy test
- 2020Mechanical Parabolic SAR as an always-in flip after a breakout
- 2020Layering Relative Strength Index, MACD, and Parabolic SAR onto relative rotation maps