2015issue C0924-26
Dual-zone currency indexes filter parabolic SAR signals
A personal euro index and a reverse dollar index give each currency bloc its own equal-unit reading. Parabolic SAR then arms a conservative EUR/USD trend hypothesis only when both zone indexes share the same stop-and-reverse side of price.
- A personal currency index quotes the euro against an equal-unit basket of USD, JPY, GBP, AUD, CHF, and CAD, while a reverse dollar index sums those counterparts versus the dollar.
- Parabolic SAR with parameters 0.02, 2.0, and 0.02 classifies each daily index as bullish or bearish; a conservative EUR/USD long or short needs the same reading on both indexes.
- When the two index signals disagree, any open EUR/USD position is closed. Contradictory SAR readings are treated as a mean-reversion or stand-aside stage.
- Equal unit weights make the intermarket filter one custom instrument, and the SAR overlay can be replaced by another trend-following rule.
Two zone indexes, one pair
A personal currency index is a trader-built basket that measures one currency against an equal-unit set of liquid counterparts so zone-level drift is visible without a vendor index. A euro-zone personal index can be formed by quoting the euro against an equal-unit basket of USD, JPY, GBP, AUD, CHF, and CAD.
A reverse dollar index is a custom sum of the same counterparts quoted versus the dollar so dollar-zone pressure can be read separately from euro-zone pressure. It is assembled as the sum of EUR, JPY, GBP, AUD, CHF, and CAD, each quoted versus USD. Together the two indexes act as an intermarket filter: a pair trade is taken only when both currency blocs move in a mutually consistent direction.
Equal-unit construction
Each currency unit in a personal index is assigned equal volume so the intermarket filter uses one custom instrument. An equal-unit basket gives each counterpart currency the same unit weight instead of turnover-based or proprietary weights. Counterpart currencies that represented 2% or less of overall turnover were omitted from the constructed indexes.
The stop-and-reverse overlay
Parabolic SAR with parameters 0.02, 2.0, and 0.02 is applied to both daily indexes to classify bullish versus bearish index stance. The overlay is bullish when its value sits below index price and bearish when it sits above.
Parabolic SAR is the worked instance of a trend-following overlay. The SAR overlay can be replaced by another trend-following rule.
Signal consistency and flattening
Signal consistency is the state in which both zone indexes share the same parabolic SAR side of price and therefore license a pair entry. A conservative EUR/USD long requires simultaneous bullish parabolic SAR readings on both the euro index and the reverse dollar index. A short requires simultaneous bearish readings.
Signal inconsistency is the state in which the two indexes do not share the same SAR side of price. When the two index signals disagree, any open EUR/USD position is closed rather than held through mixed intermarket conditions. Agreement between the two indexes is used to isolate coordinated trend phases, while contradictory SAR readings are treated as a mean-reversion or stand-aside stage.
Close-price entries and exits
Entries and exits are placed at the daily closing price after checking whether both SAR values sit below or above their respective index prices.
Historical examination
The dual-index procedure was examined on daily data from 1 January 2005 through 1 April 2015 without commissions, spreads, swaps, or risk-management overlays.
EUR/USD daily closes in the dual-index SAR example, Aug–Nov 2010
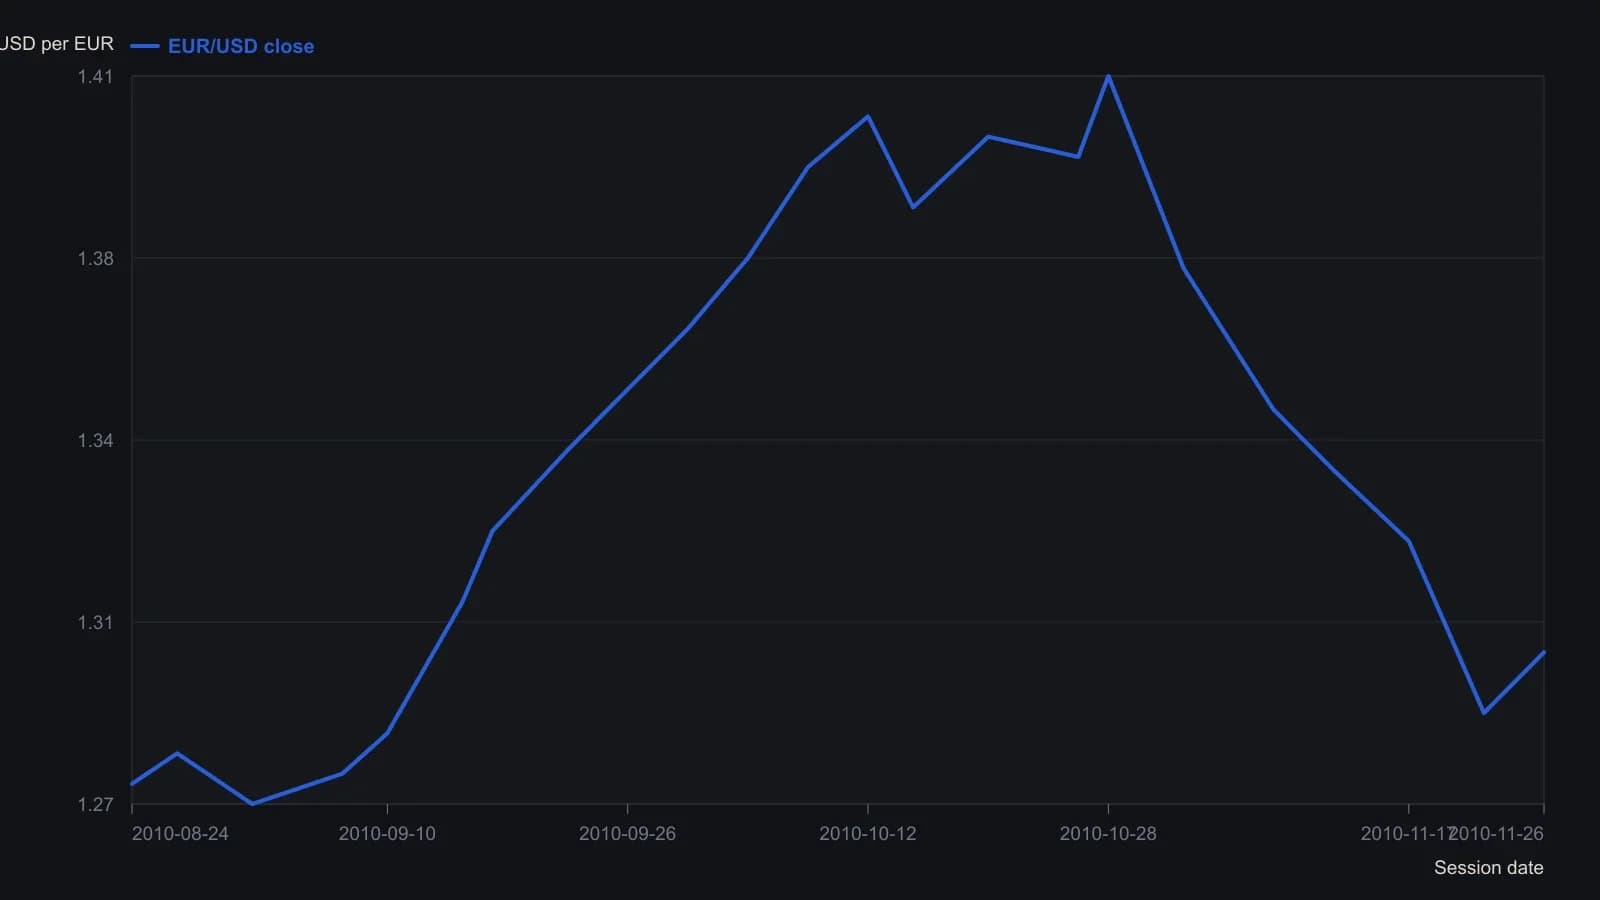
The published rule applies parabolic SAR(0.02, 2.0, 0.02) to the euro index and the reverse dollar index, not to EUR/USD itself. Green bands on the source pane mark index agreement (hold); orange bands mark disagreement (flatten). Those index panes use other units and are omitted here. Backtests ignored commissions, spreads and swaps.
All readings on this track · 21 readings
- 1987Constructing parabolic stops and cycle-window averages
- 1989Evaluating always-in parabolic SAR trailing stops
- 1993Constructing parabolic time-price trailing stops
- 1995Constructing parabolic SAR as an accelerating trail
- 1995Constructing a noise-buffered parabolic trailing stop
- 1997Constructing a parabolic trailing stop that only tightens
- 1998Triangle breakouts filtered by an exponential average and exited with parabolic stops
- 2000Treat volume-price imbalance as a hypothesis and let Parabolic SAR hold the exit
- 2002Constructing volatility stops from average true range and parabolic SAR
- 2002Parabolic SAR construction from stop outputs to reversal signals
- 2002Always-in-market SAR trail with directional confirmation
- 2004Forex trend confirmation with Average Directional Index, Parabolic SAR, and trendlines
- 2006Permission and fill gates for mechanical systems
- 2008A Relative Strength Index channel for profit lock and a trailing stop for capital protection
- 2010Building loss limits from the parabolic stop-and-reverse plot
- 2015Dual-zone currency indexes filter parabolic SAR signals
- 2016A parabolic trailing stop is not a complete system
- 2019Assigning jobs in a stochastic, parabolic, and moving-average stack
- 2019A three-filter stack as a redundancy test
- 2020Mechanical Parabolic SAR as an always-in flip after a breakout
- 2020Layering Relative Strength Index, MACD, and Parabolic SAR onto relative rotation maps