1995issue C041-3
Constructing parabolic SAR as an accelerating trail
A parabolic stop-and-reverse trail starts at the opposite extreme, steps faster only when a new extreme prints, and is clamped outside the last two bars. Whether a hit only exits or also reverses is a separate construction choice.
- A parabolic stop-and-reverse construction stays on one side of the market and flips when the trailing SAR level is reached.
- When a long opens after a recent extreme high is broken, the first SAR sits at the recent extreme low, with an opening acceleration factor of 0.02 that rises by 0.02 only on a new extreme and does not pass 0.20.
- The next bar’s SAR is the current SAR plus the acceleration factor times the gap to the extreme price, then a range-clamp keeps that value outside today’s and yesterday’s price range.
- The same arithmetic can be run on 60-minute and weekly bars; because the first SAR can sit far from entry, the line can be reserved as a late-trade stop-loss or trend check.
What the construction does
A parabolic SAR is a time-and-price trail that starts at the opposite extreme of the current side and then steps toward price faster as new extremes print. In the archive workflow, a parabolic stop-and-reverse construction stays on one side of the market at all times and flips when the trailing SAR level is reached.
Stop-and-reverse is a construction choice that closes the current side and opens the opposite side at the same SAR hit. A trailing stop is a loss bound that is advanced in the trade’s favor as price makes new extremes rather than left at a fixed level. A stop-loss is a predefined exit level that closes the current side if price returns through the trail.
Placing the first long-side SAR
When a long is opened after a recent extreme high is broken, the first SAR is placed at the recent extreme low. The extreme price is the most favorable high or low recorded since the current side began.
The opening acceleration factor in the worked long example is 0.02 applied to the gap between the extreme high and the extreme low. The acceleration factor is the step-size multiplier that starts small, rises only on a new extreme in the trade, and is capped so the trail cannot tighten without limit.
Stepping the trail and applying the range-clamp
The acceleration factor rises by 0.02 only when that trade prints a new extreme and does not increase past 0.20. The next bar’s SAR equals the current SAR plus the acceleration factor times the difference between the extreme price and the current SAR.
A range-clamp is a placement rule that forbids tomorrow’s SAR from sitting inside today’s or yesterday’s bar range. If the calculated value would fall inside, it is clamped to the nearer range extreme and that clamped value is reused in the next calculation.
Time scale, ranges, and a late-trade use
The same SAR arithmetic can be run on 60-minute bars and on weekly bars. In a range rather than a trend, buy-side SAR hits tend to occur near range highs and sell-side hits near range lows.
Because the first SAR can sit far from the entry, the line can be reserved as a late-trade stop-loss or trend check instead of as the entry trigger.
IBM daily bars with accelerating SAR trail
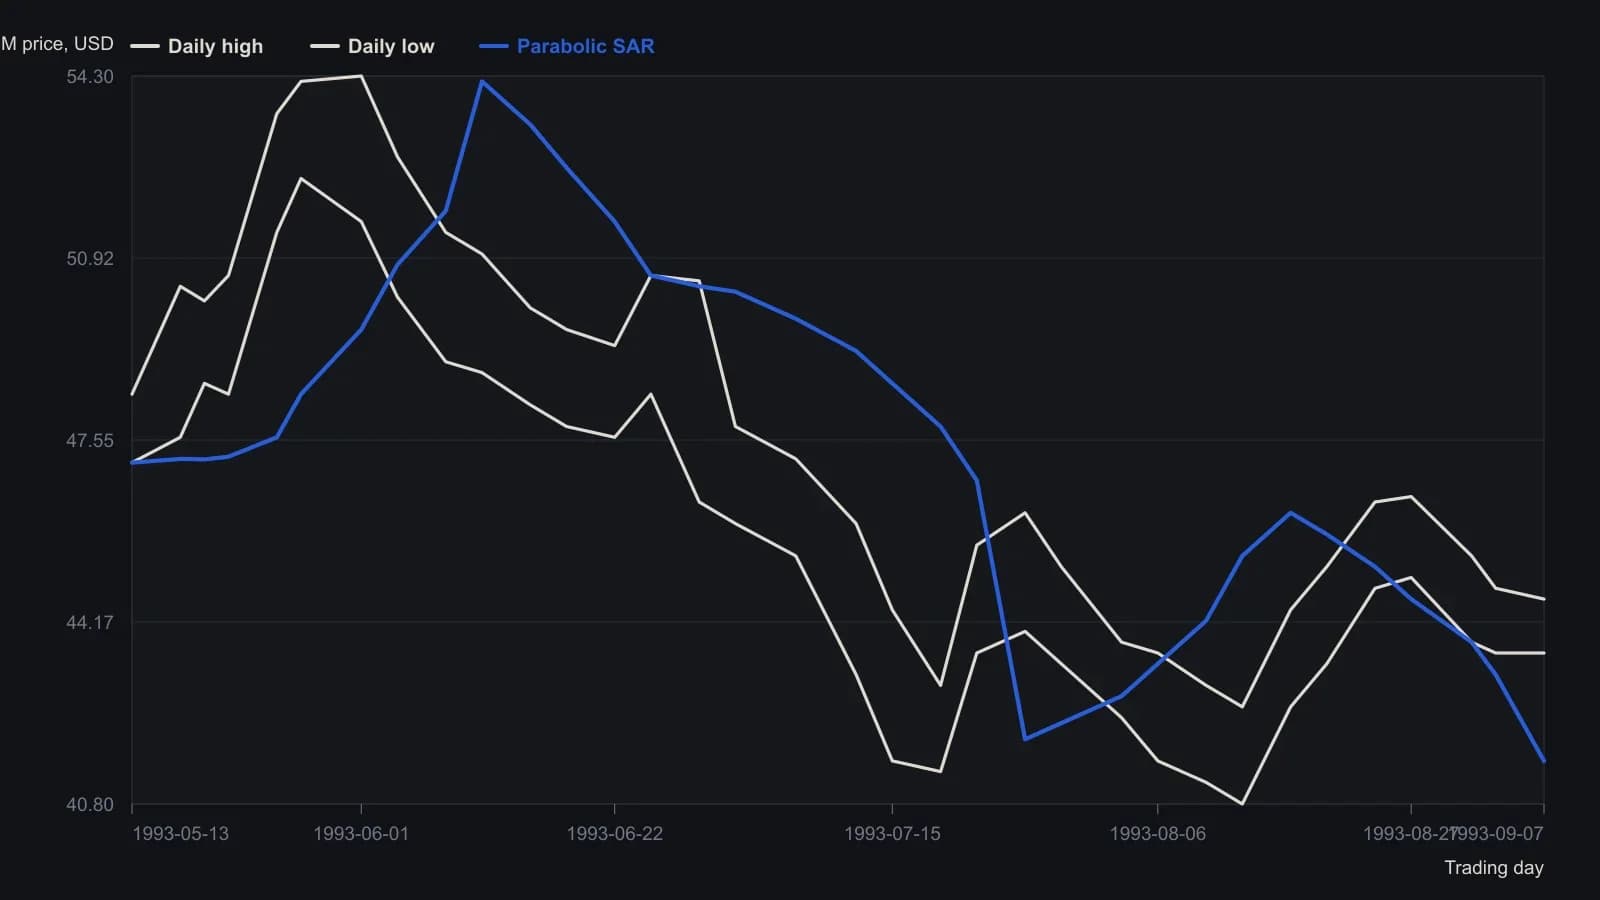
Sidebar Figure 2 has no printed table. High, low and SAR were read from the raster against the labeled 40–56 dollar scale; expect about a quarter-point uncertainty. Text gives only the first two SAR steps (47.185, 47.244).
All readings on this track · 21 readings
- 1987Constructing parabolic stops and cycle-window averages
- 1989Evaluating always-in parabolic SAR trailing stops
- 1993Constructing parabolic time-price trailing stops
- 1995Constructing parabolic SAR as an accelerating trail
- 1995Constructing a noise-buffered parabolic trailing stop
- 1997Constructing a parabolic trailing stop that only tightens
- 1998Triangle breakouts filtered by an exponential average and exited with parabolic stops
- 2000Treat volume-price imbalance as a hypothesis and let Parabolic SAR hold the exit
- 2002Constructing volatility stops from average true range and parabolic SAR
- 2002Parabolic SAR construction from stop outputs to reversal signals
- 2002Always-in-market SAR trail with directional confirmation
- 2004Forex trend confirmation with Average Directional Index, Parabolic SAR, and trendlines
- 2006Permission and fill gates for mechanical systems
- 2008A Relative Strength Index channel for profit lock and a trailing stop for capital protection
- 2010Building loss limits from the parabolic stop-and-reverse plot
- 2015Dual-zone currency indexes filter parabolic SAR signals
- 2016A parabolic trailing stop is not a complete system
- 2019Assigning jobs in a stochastic, parabolic, and moving-average stack
- 2019A three-filter stack as a redundancy test
- 2020Mechanical Parabolic SAR as an always-in flip after a breakout
- 2020Layering Relative Strength Index, MACD, and Parabolic SAR onto relative rotation maps