1993issue C111-7
Constructing parabolic time-price trailing stops
This article rebuilds the parabolic time and price stop as a session-by-session reversal that starts far from entry and steepens after new extremes. The same path can be held back from the first fill and used only as a late-trade stop-loss.
- A long side starts when a recent extreme high is broken, and the first stop-and-reverse sits at the recent extreme low so the position has room if the trend is slow to start.
- Each later stop equals today’s stop plus the acceleration factor times the gap to the extreme price. The factor starts at 0.02, rises by 0.02 only on a new extreme, and does not go above 0.20.
- Tomorrow’s stop is constrained so it cannot sit inside the last two sessions, and a worksheet tracks direction, extreme price, factor steps, the increment, and whether price hits the stop.
- Because an always-in reversal leaves the first adverse distance unknown, some constructions keep separate entries and use the same curve only to confirm direction and to place a late-trade stop-loss.
An always-in time and price stop
The parabolic time and price construction is an automatic reversal system. It stays continuously long or short. A long side begins when a recent extreme high is broken. The first trailing stop-and-reverse is then placed at the recent extreme low.
A stop-and-reverse exits the current side and enters the opposite side at the same stop, so the account does not stand aside. Once a long side is open, that stop advances each session. It moves slowly at first and then faster. A plot of the stop path therefore has a parabolic shape.
The first stop is placed far from entry so a position has room if a trend is slow to start. Later the stop closes that gap as time passes and new extremes appear.
How the stop advances
The next stop equals today’s stop plus the acceleration factor times the gap between the extreme price and today’s stop. Extreme price is the highest high on a long side, or the lowest low on a short side, since the current position began.
The acceleration factor starts at 0.02. It rises by 0.02 only when a new extreme prints, and it does not exceed 0.20.
A worked long-side start
A worked long-side start uses a 50.125 extreme high and a 47.125 extreme low. That pairing produces a first next-session stop of 47.185. If the next session fails to make a new high, the same 0.02 factor and the same extreme high are reused, giving 47.244.
Keeping the stop outside recent trade
Tomorrow’s stop may not sit inside today’s or yesterday’s range. On a long side it is pulled down to the lower of the calculated value and the last two lows. On a short side it may not sit below the last two highs.
That price-range constraint keeps tomorrow’s stop outside the last two sessions’ highs and lows so the stop cannot sit inside recent trade.
A worksheet that branches
A worksheet implementation tracks direction, extreme price, acceleration-factor steps, the stop increment, and whether the current session’s price hits the stop. Nested conditionals are required because those rules branch.
IBM daily parabolic stop versus the close
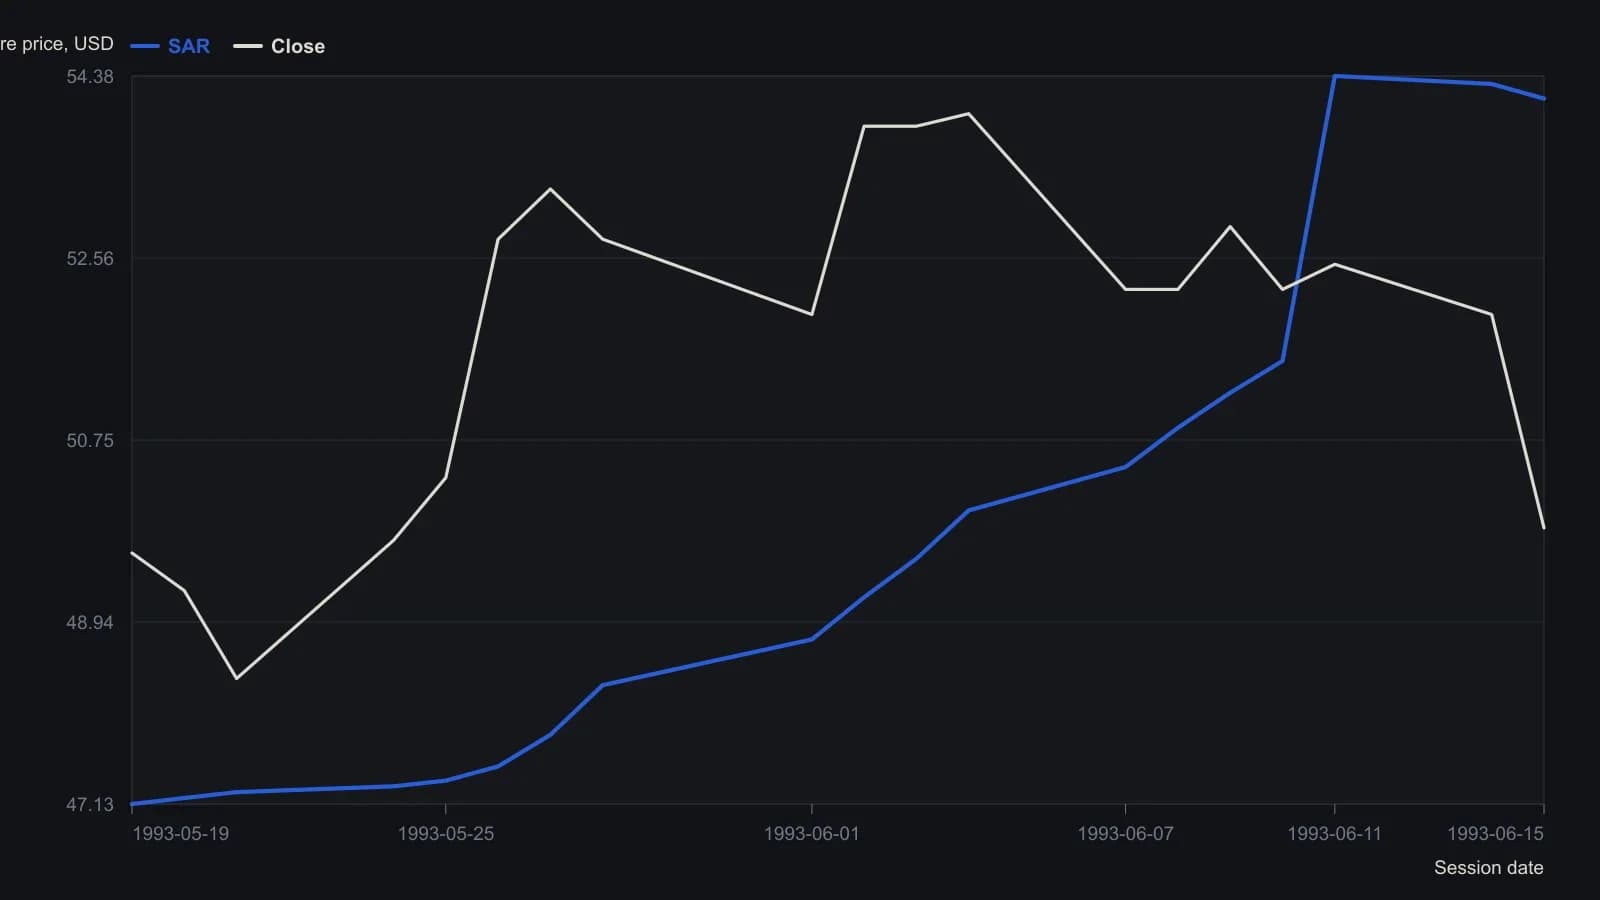
Acceleration factor starts at 0.02, adds 0.02 only on a new extreme, and is capped at 0.20. Tomorrow’s SAR is not allowed inside the prior two sessions’ range.
The same curve on other bars
The same stop construction can be applied on 60-minute bars and on weekly bars. In a trend the stop stays a distance from price and tightens as the trend persists. Sideways action brings the stop closer and can trigger it.
In extended trading ranges, long-side stops tend to be hit near range highs and short-side stops near range lows.
Using the curve only as a late-trade stop
Some constructions therefore keep separate entries and use the parabolic only to confirm direction and to place a late-trade stop-loss. A trailing stop advances with favorable extremes so the allowed adverse excursion shrinks as the position ages. A stop-loss is a predetermined exit that bounds adverse price movement before entry and while the position is open.
An always-in stop-and-reverse leaves the first adverse distance unknown and potentially large. The same formula is sometimes withheld from entry and used only as a trailing stop-loss after a trend is already underway.
All readings on this track · 21 readings
- 1987Constructing parabolic stops and cycle-window averages
- 1989Evaluating always-in parabolic SAR trailing stops
- 1993Constructing parabolic time-price trailing stops
- 1995Constructing parabolic SAR as an accelerating trail
- 1995Constructing a noise-buffered parabolic trailing stop
- 1997Constructing a parabolic trailing stop that only tightens
- 1998Triangle breakouts filtered by an exponential average and exited with parabolic stops
- 2000Treat volume-price imbalance as a hypothesis and let Parabolic SAR hold the exit
- 2002Constructing volatility stops from average true range and parabolic SAR
- 2002Parabolic SAR construction from stop outputs to reversal signals
- 2002Always-in-market SAR trail with directional confirmation
- 2004Forex trend confirmation with Average Directional Index, Parabolic SAR, and trendlines
- 2006Permission and fill gates for mechanical systems
- 2008A Relative Strength Index channel for profit lock and a trailing stop for capital protection
- 2010Building loss limits from the parabolic stop-and-reverse plot
- 2015Dual-zone currency indexes filter parabolic SAR signals
- 2016A parabolic trailing stop is not a complete system
- 2019Assigning jobs in a stochastic, parabolic, and moving-average stack
- 2019A three-filter stack as a redundancy test
- 2020Mechanical Parabolic SAR as an always-in flip after a breakout
- 2020Layering Relative Strength Index, MACD, and Parabolic SAR onto relative rotation maps