1997issue C071-3
Constructing a parabolic trailing stop that only tightens
The parabolic stop is built as a one-way ratchet from the trade's extreme price and an acceleration factor. A separate rule then decides whether a touch reverses, exits, or only authorizes a better-priced limit.
- The parabolic is a stop-and-reverse line that stays in the market and flips when price touches the computed value, and the same line can trail an already open swing as it curves into the bars.
- Each new stop equals the current stop plus an acceleration factor times the gap to the trade's most favorable extreme, and the line cannot ease against the trade.
- A reverse at the touch is structurally late, so the construction is meant for directional conditions rather than sideways markets.
- The acceleration factor starts at 0.02, rises by 0.02 only when a new favorable extreme prints, and is capped at 0.20. Parameters from prior experience are not rewritten merely because live bars look imperfect.
A line that stays in the market
The parabolic is constructed as a stop-and-reverse line that stays in the market and flips long or short when price touches the computed value. Stop-and-reverse, in this construction, is a participation rule that stays always long or always short, flipping when price reaches the current stop instead of going flat.
The same line is also used as a trailing exit on an already open swing because it curves into the bars as the move extends. The trailing-stop here is that computed parabolic value: a protective level that may only tighten as the position moves favorably, follows price, and cannot ease against the trade. The stop-loss is the same bound, a pre-planned exit or reverse level that bounds loss or exposure before entry and while the position is open.
Parabolic SAR trailing Coca-Cola through 1996
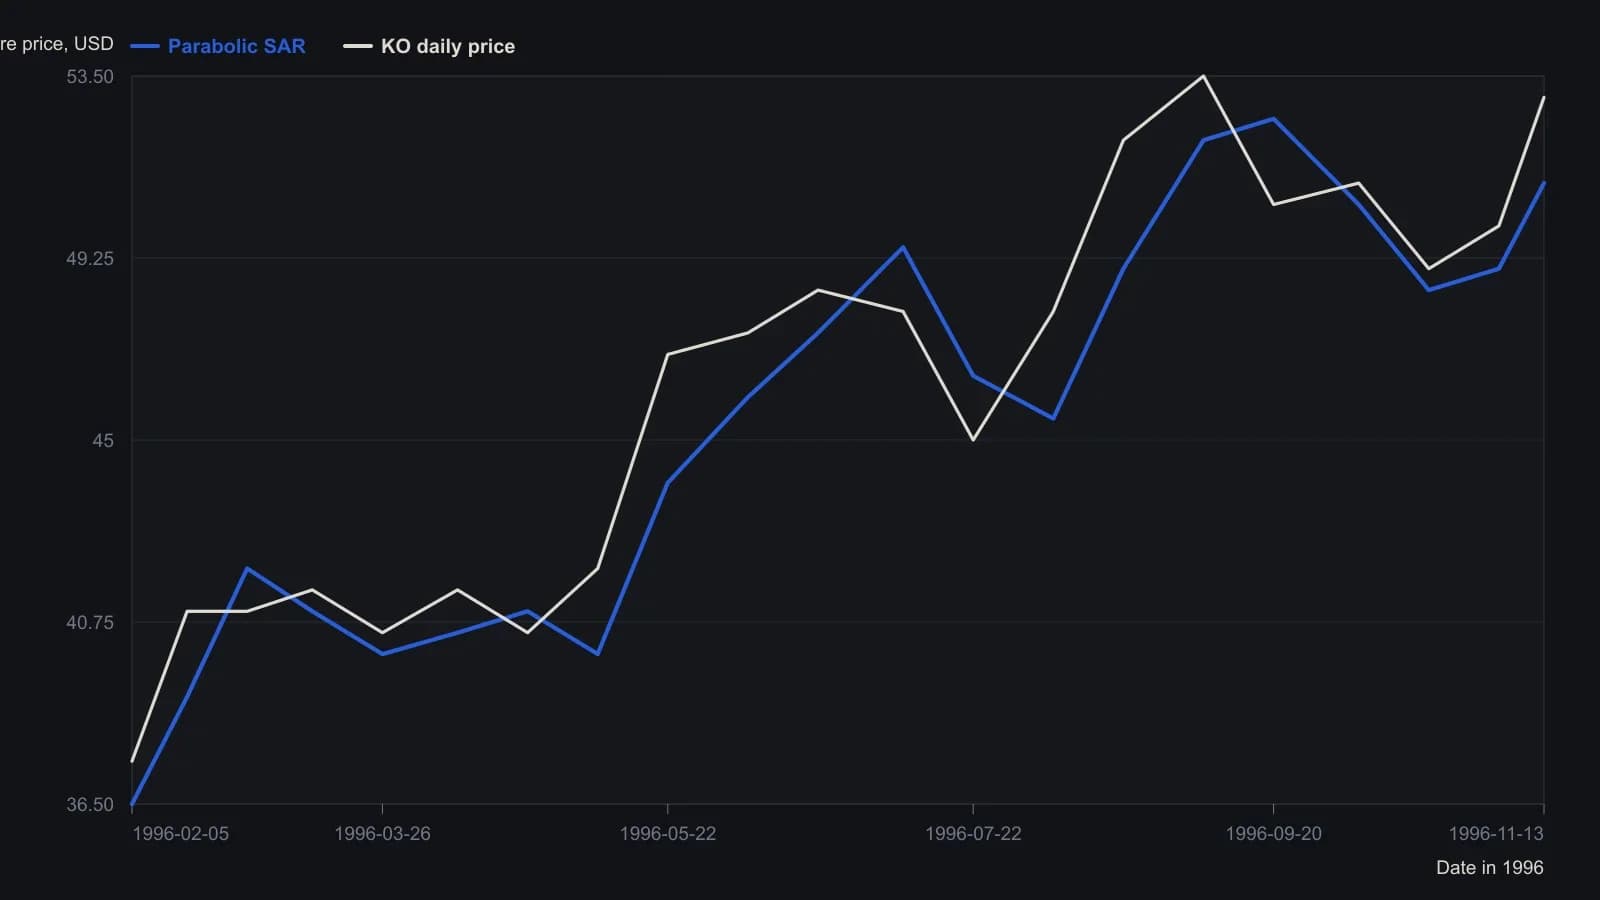
MetaStock Parabolic SAR on daily KO, window dated 13 Nov 1996, using Wilder's default 0.02 step and 0.20 cap. Readings are approximate to the nearest half dollar. The stop series jumps at each reverse because the published study plots a new SAR on the opposite side of the bar.
Start from the prior swing
A new long initializes the stop at the prior decline's low, and a new short initializes it at the prior rise's high. From that point the extreme price is the most favorable high when long, or the most favorable low when short, printed since the current trade began. That extreme is the reference the stop chases.
Update as a one-way ratchet
Each new stop equals the current stop plus an acceleration factor times the gap from that stop to the trade's most favorable extreme. While long the stop cannot fall, and while short it cannot rise. Without a new favorable extreme the acceleration factor is left unchanged and the line may flatten but not ease.
Step the acceleration factor
The acceleration factor is the step size that pulls the stop toward the trade's extreme. It increases only on a new favorable extreme and is usually capped so the line cannot lunge all the way to price in one bar. In this construction it starts at 0.02, rises by 0.02 only when a new favorable extreme prints, and is capped at 0.20.
Raising the acceleration factor pulls the stop toward price faster, which can cut range damage sooner at the cost of exiting a still-extending trend earlier. Parameters chosen from prior experience are not rewritten merely because live bars look imperfect.
Choose what a touch authorizes
Because a flip at the touch waits on adverse movement, the construction is meant for directional conditions rather than sideways markets. The line still updates from the trade's extreme and the acceleration factor. What changes is the participation rule attached to the touch.
The touch can be treated as the signal while the working order is a limit at a more favorable price, with the offset judged from five- to ten-day range volatility. In that reading the parabolic remains a time-and-price line that turns a price touch into a long or short hypothesis, without forcing an immediate reverse at the computed value.
All readings on this track · 21 readings
- 1987Constructing parabolic stops and cycle-window averages
- 1989Evaluating always-in parabolic SAR trailing stops
- 1993Constructing parabolic time-price trailing stops
- 1995Constructing parabolic SAR as an accelerating trail
- 1995Constructing a noise-buffered parabolic trailing stop
- 1997Constructing a parabolic trailing stop that only tightens
- 1998Triangle breakouts filtered by an exponential average and exited with parabolic stops
- 2000Treat volume-price imbalance as a hypothesis and let Parabolic SAR hold the exit
- 2002Constructing volatility stops from average true range and parabolic SAR
- 2002Parabolic SAR construction from stop outputs to reversal signals
- 2002Always-in-market SAR trail with directional confirmation
- 2004Forex trend confirmation with Average Directional Index, Parabolic SAR, and trendlines
- 2006Permission and fill gates for mechanical systems
- 2008A Relative Strength Index channel for profit lock and a trailing stop for capital protection
- 2010Building loss limits from the parabolic stop-and-reverse plot
- 2015Dual-zone currency indexes filter parabolic SAR signals
- 2016A parabolic trailing stop is not a complete system
- 2019Assigning jobs in a stochastic, parabolic, and moving-average stack
- 2019A three-filter stack as a redundancy test
- 2020Mechanical Parabolic SAR as an always-in flip after a breakout
- 2020Layering Relative Strength Index, MACD, and Parabolic SAR onto relative rotation maps