2020issue C1228-33
Layering Relative Strength Index, MACD, and Parabolic SAR onto relative rotation maps
Keep Relative Strength Index, MACD, and Parabolic SAR as the single-name signal language, then place the same names on a two-axis relative-trend map. The editorial drill tests when those oscillator and stop-and-reverse cues agree with a clockwise sector rotation and when they diverge.
- An early chart toolkit featured the Relative Strength Index and MACD, tried Parabolic SAR after a 1978 stop-and-reverse book, then returned to those first two tools and later added relative-trend and relative-momentum lines.
- The Relative Strength Index was the exception that was retuned, with a nine-period lookback so readings would cross seventy and thirty more quickly, while most other indicators kept default parameters.
- The JdK RS ratio and JdK RS momentum form four quadrants around a benchmark, and illustrated sector paths generally travel clockwise from leading into weakening, lagging, and then improving states.
- Relative-strength ranking was adopted because the same directional buy rule on all twenty-five names in a local index merely replicated that index, and the two-axis map was designed to show a full sector landscape in one image.
A two-layer reading drill
The archive facts describe a historical workflow. An early chart toolkit featured the Relative Strength Index and MACD, plus trials of Parabolic SAR after a 1978 stop-and-reverse book, before practice returned to those first two tools and later added relative-trend and relative-momentum lines.
Editorial reading: keep the Relative Strength Index, MACD, and Parabolic SAR as the single-name signal language, then place the same names on a two-axis relative-trend map. The drill is to test when oscillator and stop-and-reverse cues agree with a clockwise sector rotation and when they diverge.
What the early toolkit kept and retuned
The Relative Strength Index lookback was set to nine periods instead of the common fourteen-period default so readings would cross seventy and thirty more quickly. Default parameters were kept for most other indicators, with the Relative Strength Index treated as the exception that was retuned.
How the relative-rotation map is built
A relative-rotation scatterplot is built from the JdK RS ratio and JdK RS momentum, which together form four quadrants around a benchmark at the center. Illustrated sector paths generally travel clockwise from a leading state into weakening, lagging, and then improving states versus that benchmark.
One printed map used eight-week tails for a full sector set, another used thirty-week tails on fewer names, and a fifteen-week overlay packed with many tickers became unreadable. The two-axis map was designed so an entire sector landscape could be read in one image instead of a stack of separate charts.
Eight-week S&P sector returns on the RRG tail
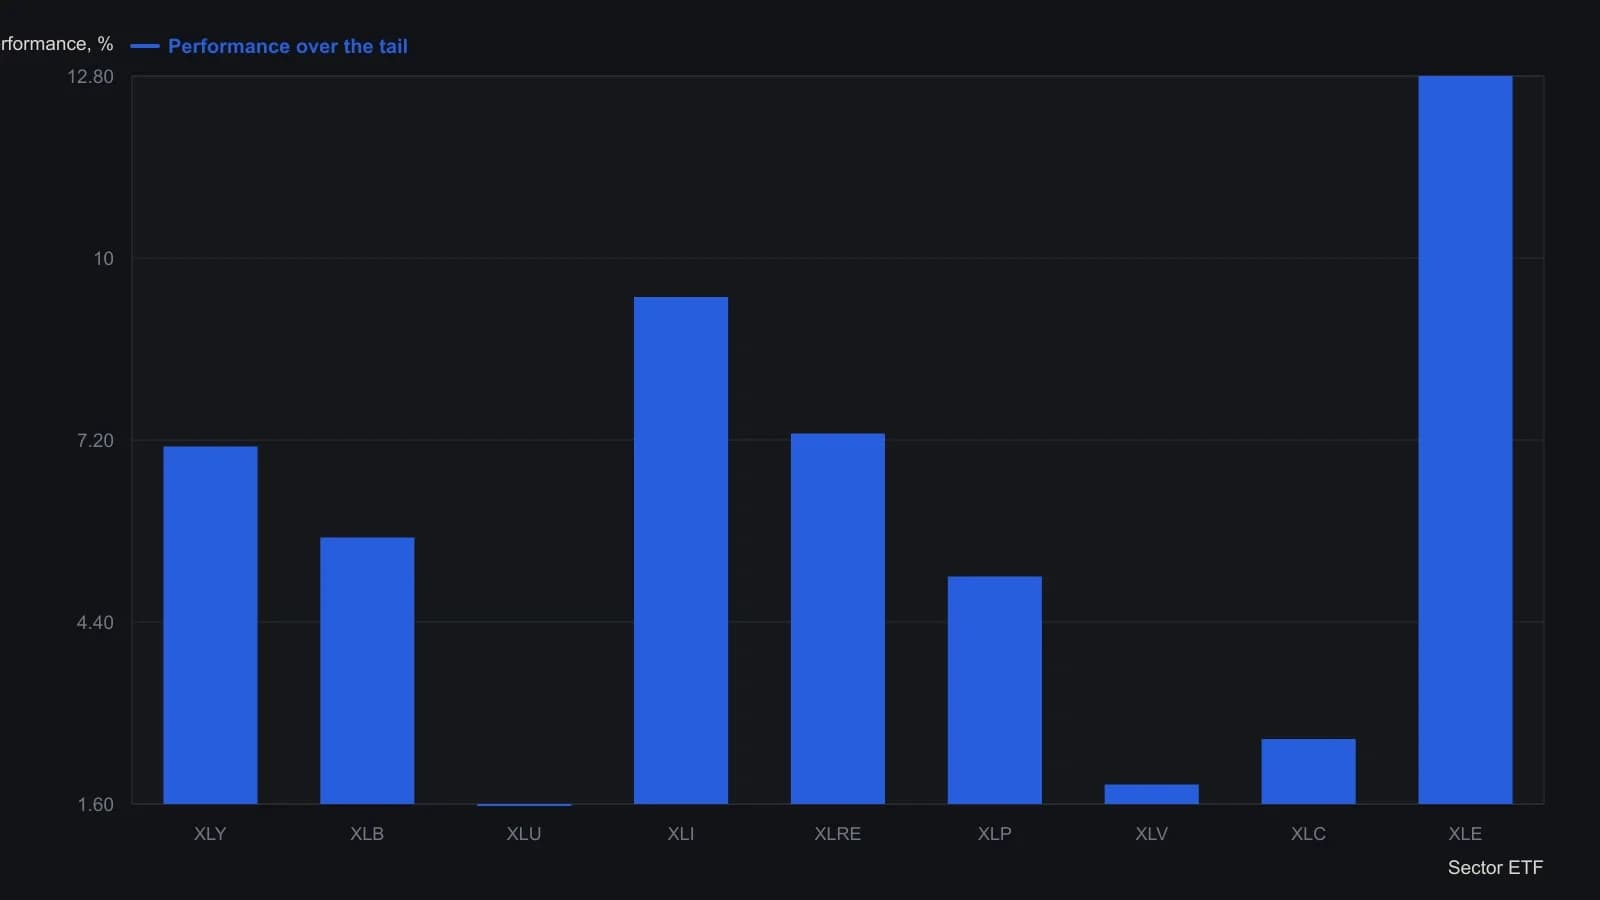
Figure 1 uses an eight-week tail on S&P 500 sector SPDRs versus SPY. The published crop does not show technology (XLK) or financials (XLF), so those two names are omitted rather than filled in.
Why ranking replaced a uniform buy rule
Relative-strength ranking was adopted because applying the same directional buy rule to all twenty-five names in a local index merely replicated that index.
Editorial close: after the single-name Relative Strength Index, MACD, and Parabolic SAR cues are read, place the same names on the four-quadrant map and ask whether those cues travel with a clockwise path or stand apart from it.
All readings on this track · 21 readings
- 1987Constructing parabolic stops and cycle-window averages
- 1989Evaluating always-in parabolic SAR trailing stops
- 1993Constructing parabolic time-price trailing stops
- 1995Constructing parabolic SAR as an accelerating trail
- 1995Constructing a noise-buffered parabolic trailing stop
- 1997Constructing a parabolic trailing stop that only tightens
- 1998Triangle breakouts filtered by an exponential average and exited with parabolic stops
- 2000Treat volume-price imbalance as a hypothesis and let Parabolic SAR hold the exit
- 2002Constructing volatility stops from average true range and parabolic SAR
- 2002Parabolic SAR construction from stop outputs to reversal signals
- 2002Always-in-market SAR trail with directional confirmation
- 2004Forex trend confirmation with Average Directional Index, Parabolic SAR, and trendlines
- 2006Permission and fill gates for mechanical systems
- 2008A Relative Strength Index channel for profit lock and a trailing stop for capital protection
- 2010Building loss limits from the parabolic stop-and-reverse plot
- 2015Dual-zone currency indexes filter parabolic SAR signals
- 2016A parabolic trailing stop is not a complete system
- 2019Assigning jobs in a stochastic, parabolic, and moving-average stack
- 2019A three-filter stack as a redundancy test
- 2020Mechanical Parabolic SAR as an always-in flip after a breakout
- 2020Layering Relative Strength Index, MACD, and Parabolic SAR onto relative rotation maps