2002issue C041-3
Always-in-market SAR trail with directional confirmation
Parabolic SAR is plotted once per bar as a stop-and-reverse trail that stays in the market. The archive treats that trail as incomplete on its own and pairs each flip with plus and minus directional-movement lines, so a reverse is reviewed as a combination rule rather than a standalone signal.
- Parabolic SAR is plotted as one marker per bar, below price while long and above price while short.
- A price cross of the trail closes the current side and opens the opposite side so the method stays in the market continuously.
- The source treats SAR as incomplete on its own and pairs it with plus and minus directional-movement lines as confirmation.
- The pairing is presented as a study method for paper review, not as a complete or sufficient trading solution.
One marker per bar
Parabolic SAR is plotted as one marker per bar on any timeframe, below price while long and above price while short. The plot is a stop-and-reverse trail that flips when price crosses it.
A reverse that stays in the market
A price cross of the SAR trail is treated as a stop-and-reverse event: the current side is closed and the opposite side is opened at the same stop so the method stays in the market continuously.
A trail that tightens as the trend matures
The trail is described as giving more room for early countertrend noise, then tightening as a protective trailing stop as the trend matures. That advancing trail is the trailing-stop implementation in this pairing.
The long-side sell stop equals the prior SAR plus the acceleration factor times the gap from that SAR to the new high since the long began. The short-side buy stop uses the analogous new-low gap.
The acceleration factor starts at 0.02 on entry and increases by 0.02 each period that price advances toward the highest high since that long began. It is a step-up coefficient that rises by the same increment when price makes a new extreme in the trade's favor.
The trail still advances in a flattening market
The trail is said to advance each period even without favorable price action, so a flattening market closes the gap until a reverse prints.
Directional lines confirm or reject a flip
The source treats SAR as incomplete on its own and pairs it with plus and minus directional-movement lines as confirmation. Those lines are used here to confirm or reject a SAR flip rather than to forecast a standalone entry.
What the illustrated cases showed
In the illustrated cases a plus-minus directional cross often arrived within one or two sessions of a SAR long flip, and several flattening bars sometimes preceded the reverse. One chart sequence is used to show SAR blocking a sustained long after a brief flip when directional confirmation lagged.
IBM daily price and parabolic SAR trail, March–September 2001
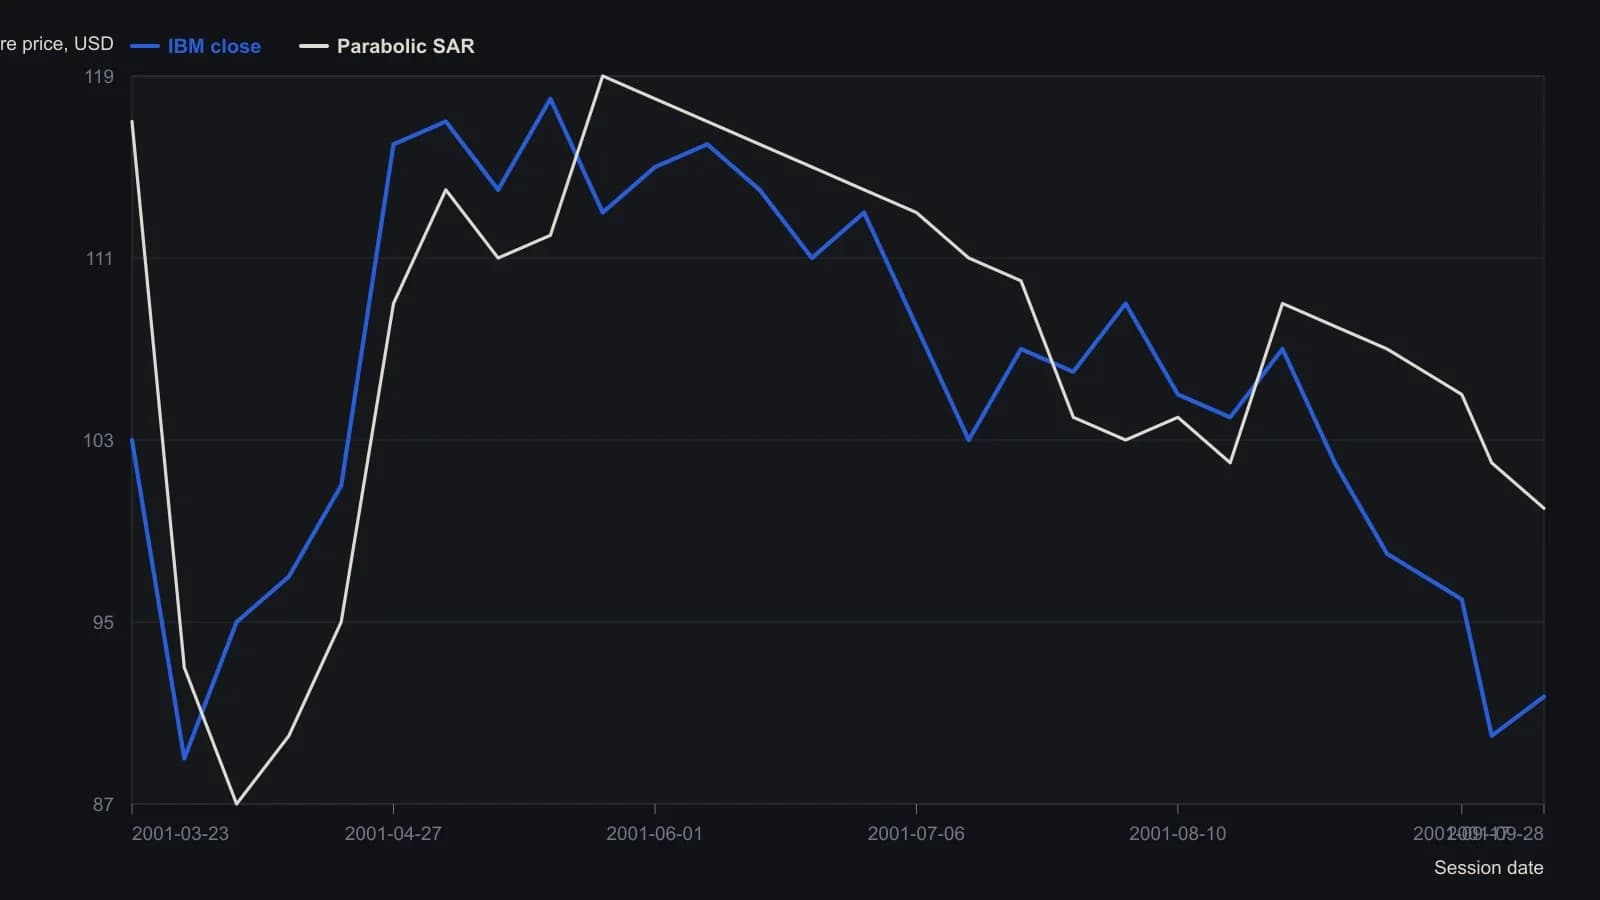
Digitized from a daily candlestick raster and approximate to about one dollar, except the 28 September 2001 close taken from the chart header. The lower-pane plus/minus directional-movement lines use a different scale and are omitted.
A study method, not a complete solution
The source presents the combination as a study method for paper review, not as a complete or sufficient trading solution.
All readings on this track · 21 readings
- 1987Constructing parabolic stops and cycle-window averages
- 1989Evaluating always-in parabolic SAR trailing stops
- 1993Constructing parabolic time-price trailing stops
- 1995Constructing parabolic SAR as an accelerating trail
- 1995Constructing a noise-buffered parabolic trailing stop
- 1997Constructing a parabolic trailing stop that only tightens
- 1998Triangle breakouts filtered by an exponential average and exited with parabolic stops
- 2000Treat volume-price imbalance as a hypothesis and let Parabolic SAR hold the exit
- 2002Constructing volatility stops from average true range and parabolic SAR
- 2002Parabolic SAR construction from stop outputs to reversal signals
- 2002Always-in-market SAR trail with directional confirmation
- 2004Forex trend confirmation with Average Directional Index, Parabolic SAR, and trendlines
- 2006Permission and fill gates for mechanical systems
- 2008A Relative Strength Index channel for profit lock and a trailing stop for capital protection
- 2010Building loss limits from the parabolic stop-and-reverse plot
- 2015Dual-zone currency indexes filter parabolic SAR signals
- 2016A parabolic trailing stop is not a complete system
- 2019Assigning jobs in a stochastic, parabolic, and moving-average stack
- 2019A three-filter stack as a redundancy test
- 2020Mechanical Parabolic SAR as an always-in flip after a breakout
- 2020Layering Relative Strength Index, MACD, and Parabolic SAR onto relative rotation maps