1998issue C111-4
Triangle breakouts filtered by an exponential average and exited with parabolic stops
A symmetrical triangle is taken as a breakout in either direction. A flattening 20-day exponential average confirms compression, day-only stops bracket the apex, and an apex stop later yields to a parabolic trail only when that trail is tighter.
- A symmetrical triangle uses two converging boundaries of roughly similar slope and needs at least four reversal points so each line is touched twice.
- A flattening slope on a 20-day exponential average inside the pattern is extra evidence that price is moving sideways and volatility has contracted.
- Day-only bracketing orders sit on opposite sides of the apex; after one fills, the other is canceled and an initial protective stop is placed at the apex.
- The parabolic trail replaces the apex stop only after it is more favorable, then advances each session until hit.
What the combined rules do
The historical workflow joins a contracting triangle, a flattening exponential average, and a parabolic trail into one set of entry and exit rules. The write-up takes a breakout in either direction rather than treating the triangle as a one-way continuation of the prior trend.
The triangle and the apex
A symmetrical triangle is drawn from two converging boundaries of roughly similar slope that meet at an apex. It requires at least four reversal points so each boundary is touched twice: a descending resistance line and an ascending support line. The apex is the projected meeting point of those two boundaries, and it is used both to site opposing entry stops and to locate the first protective stop.
The 20-day exponential filter
The chosen trend filter is a 20-day exponential moving average, selected because a longer length was judged too slow and a shorter length too fast. That moving average is a recalculated average of recent prices used here as a 20-session exponential trend line whose slope is inspected for flattening inside the pattern. A flattening slope of that average inside the triangle is treated as extra evidence that price is moving sideways and volatility has contracted.
The exponential average updates as the prior average plus a smoothing constant times the gap between the latest close and that prior average. The exponential smoothing constant is a weight, often estimated as two divided by one more than the simple-average length, that gives the latest observation more influence than older ones.
Day-only orders around the apex
Entry uses day-only bracketing orders: a pair of same-session stop orders placed on opposite sides of the apex so a breakout can be taken in either direction. After one fills, the opposite resting order is canceled so both sides are not executed. The same bracketing-order template is described as usable for short breakouts as well as long ones.
From the apex stop to the parabolic trail
An initial protective stop is placed at the apex as soon as a fill is received. That capital-protection order remains in force until the parabolic stop is more favorable. The parabolic stop is a trailing-stop series that accelerates toward price on an extended move and replaces the initial apex stop only after it becomes the more favorable of the two. After the parabolic stop exceeds the initial protective stop, it is advanced each session until hit, using an acceleration factor that lets the trail catch up during an extended move.
A test before capital
The write-up treats a historical test across several markets as a prerequisite before committing capital to the combined rules.
March 1998 wheat: 20-day EMA flattening inside the triangle
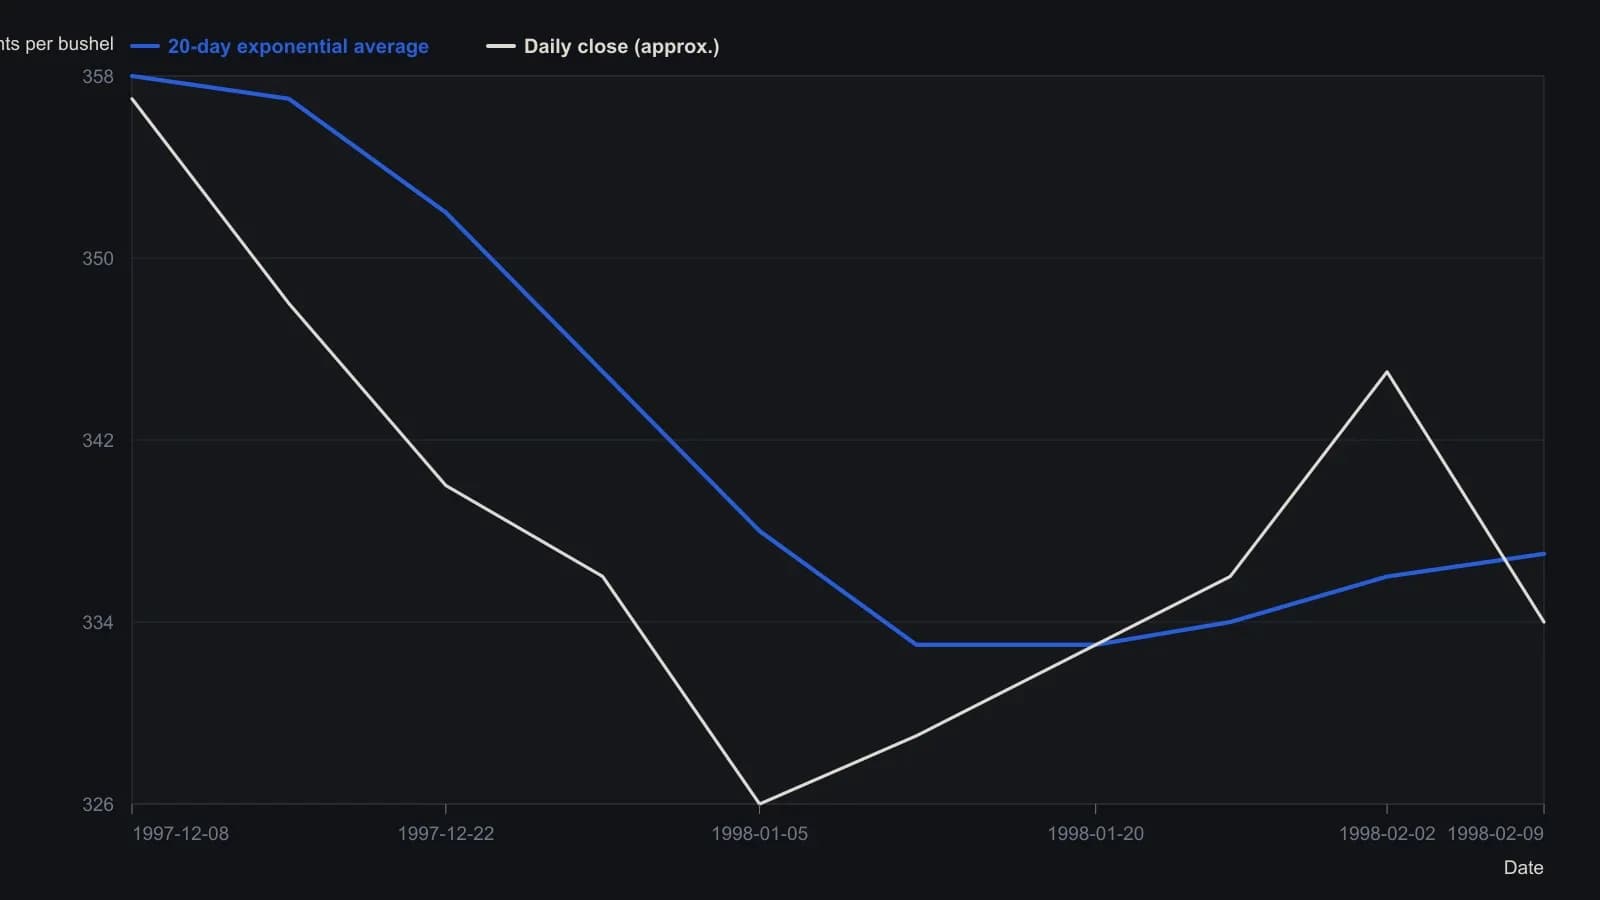
Sampled at the weekly date marks on the Fibonacci Trader daily chart. The source specifies a 20-day EMA of closes. Last close 334.00 is the figure in the chart header; other levels are read to the nearest cent against a 5-cent grid.
All readings on this track · 21 readings
- 1987Constructing parabolic stops and cycle-window averages
- 1989Evaluating always-in parabolic SAR trailing stops
- 1993Constructing parabolic time-price trailing stops
- 1995Constructing parabolic SAR as an accelerating trail
- 1995Constructing a noise-buffered parabolic trailing stop
- 1997Constructing a parabolic trailing stop that only tightens
- 1998Triangle breakouts filtered by an exponential average and exited with parabolic stops
- 2000Treat volume-price imbalance as a hypothesis and let Parabolic SAR hold the exit
- 2002Constructing volatility stops from average true range and parabolic SAR
- 2002Parabolic SAR construction from stop outputs to reversal signals
- 2002Always-in-market SAR trail with directional confirmation
- 2004Forex trend confirmation with Average Directional Index, Parabolic SAR, and trendlines
- 2006Permission and fill gates for mechanical systems
- 2008A Relative Strength Index channel for profit lock and a trailing stop for capital protection
- 2010Building loss limits from the parabolic stop-and-reverse plot
- 2015Dual-zone currency indexes filter parabolic SAR signals
- 2016A parabolic trailing stop is not a complete system
- 2019Assigning jobs in a stochastic, parabolic, and moving-average stack
- 2019A three-filter stack as a redundancy test
- 2020Mechanical Parabolic SAR as an always-in flip after a breakout
- 2020Layering Relative Strength Index, MACD, and Parabolic SAR onto relative rotation maps