1995issue C041-9
Constructing a noise-buffered parabolic trailing stop
A parabolic stop-and-reversal series can be constructed as an always-in-market trailing stop. Freeing the start acceleration factor and adding a crossover increment changes both the stop path and when a reverse is issued.
- A parabolic stop-and-reversal series is an always-in-market trailing stop that can be computed on monthly through hourly bars, including point-and-figure charts.
- Start, increment, and maximum acceleration-factor settings govern how fast the stop closes on recent extremes; many platforms lock the start at 0.02, yet changing it changes the stop path and the reverse signals.
- A crossover increment issues a reverse only after price penetrates the prior stop by a defined amount, so a tiny touch is not treated as a trend change.
- After a reverse, the stop resets to the opposite extreme of the prior swing and the acceleration factor returns to its start value.
An always-in-market trailing stop
A parabolic stop-and-reversal series is built as an always-in-market trend follower. It can be computed on any bar interval from monthly down to hourly, including point-and-figure charts.
The curve is constructed as a trailing stop that begins far enough from the entry to tolerate early retracements, then accelerates toward recent local extremes until an adverse penetration issues a reverse. In that construction the series both locates a trailing stop and issues a reverse when that stop is penetrated.
Three acceleration-factor settings
The slope and speed of the stop are governed by three acceleration-factor settings: a start value, an increment applied when a new extreme is printed, and a maximum.
Many implementations expose only the increment and the maximum while locking the start acceleration factor at 0.02. Holding the other two settings fixed while changing that start value from 0.02 to 0.08 produces a different stop path and a different set of reverse signals.
S&P 500 daily SAR at start AF 0.08 versus 0.02
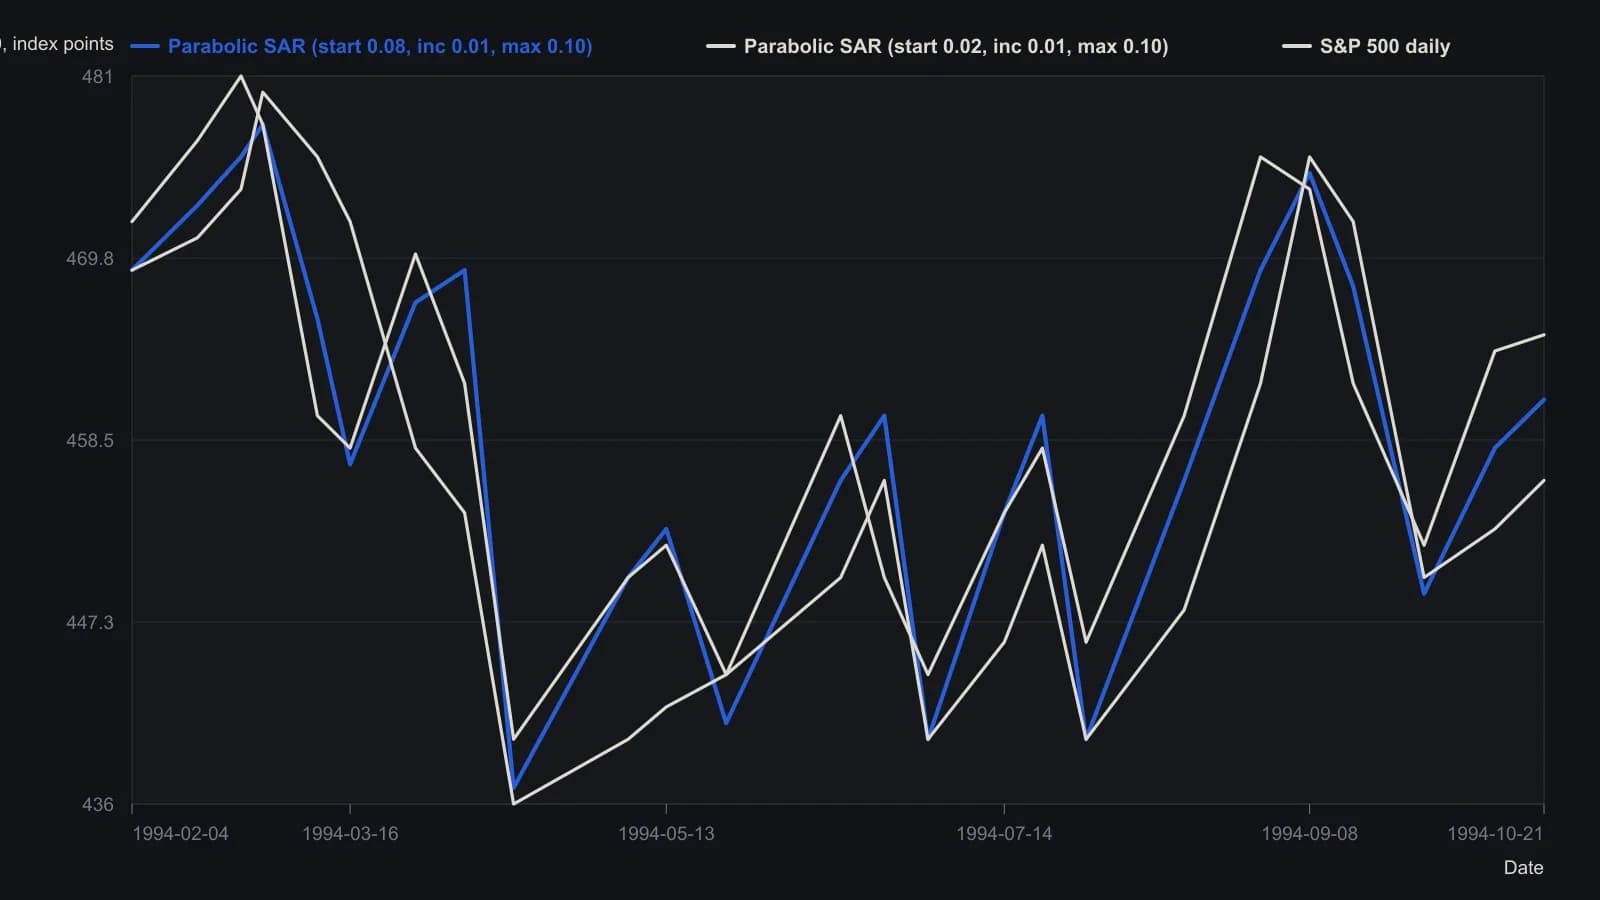
Most platforms lock start AF at 0.02. Increment and maximum are 0.01 and 0.10 on both SAR traces. Intra-month dates are placed from the F–O month letters plus the printed 10/21/94 last bar, not from a numbered day scale. The source says these settings were fit on this window and may not hold later.
When a touch is only noise
When the trailing stop hugs price, a tiny bar penetration can flip the stop-loss state. Those flips are attributed to noise in the price series rather than a genuine trend change.
The four-parameter construction adds a crossover-increment buffer so a reverse is issued only after price penetrates the prior stop by a defined amount, not on a mere touch.
How a reverse is issued
In the supplied implementation, a long position reverses when the bar low is at or below the prior stop minus the crossover increment, and a short position reverses when the bar high is at or above the prior stop plus that increment.
After a reverse, the new stop is reset to the opposite extreme of the prior swing and the acceleration factor is reset to the start value. Thereafter the stop steps toward the current extreme and the factor increments only when a new extreme is printed, capped at the maximum.
Illustrated construction sets
Illustrated construction sets include a 1.25 crossover increment on a daily equity-index series and, on 60-minute industrial-average bars, a 3.25-point crossover increment with start 0.06, increment 0.04, and maximum 1.0. Those values were obtained on a fixed sample and are not asserted to transfer.
A complete system wiring places the next-bar buy stop at the constructed stop plus the crossover increment and the next-bar sell stop at the constructed stop minus that increment.
All readings on this track · 21 readings
- 1987Constructing parabolic stops and cycle-window averages
- 1989Evaluating always-in parabolic SAR trailing stops
- 1993Constructing parabolic time-price trailing stops
- 1995Constructing parabolic SAR as an accelerating trail
- 1995Constructing a noise-buffered parabolic trailing stop
- 1997Constructing a parabolic trailing stop that only tightens
- 1998Triangle breakouts filtered by an exponential average and exited with parabolic stops
- 2000Treat volume-price imbalance as a hypothesis and let Parabolic SAR hold the exit
- 2002Constructing volatility stops from average true range and parabolic SAR
- 2002Parabolic SAR construction from stop outputs to reversal signals
- 2002Always-in-market SAR trail with directional confirmation
- 2004Forex trend confirmation with Average Directional Index, Parabolic SAR, and trendlines
- 2006Permission and fill gates for mechanical systems
- 2008A Relative Strength Index channel for profit lock and a trailing stop for capital protection
- 2010Building loss limits from the parabolic stop-and-reverse plot
- 2015Dual-zone currency indexes filter parabolic SAR signals
- 2016A parabolic trailing stop is not a complete system
- 2019Assigning jobs in a stochastic, parabolic, and moving-average stack
- 2019A three-filter stack as a redundancy test
- 2020Mechanical Parabolic SAR as an always-in flip after a breakout
- 2020Layering Relative Strength Index, MACD, and Parabolic SAR onto relative rotation maps