2019issue C0422-23
A three-filter stack as a redundancy test
The archive records a stochastic oscillator, a short moving average, and parabolic SAR used together as a scan-filter. Editorial reading: keep all three only when state, confirmation, and location are different questions about the same bar.
- The count of indicators is not treated as a decisive success factor, because many studies return the same reading from the same inputs.
- Editorial reading: keep the stochastic oscillator for state, a short moving average for confirmation, and parabolic SAR for location.
- In the high-state zone at 78 and above, position versus the 3-period average is treated as secondary because the oscillator can remain elevated with little variance.
- One scan-filter keeps long candidates when the 12,1 stochastic is above 78, or is below 78 and still above its 3-period average, and reverses those comparisons for short candidates.
Combination as a redundancy test
Technical indicators are numerical or charted outputs of formulas built from price, volume, and timing. The count of indicators in a study is not treated as a decisive success factor, because many studies return the same reading from the same inputs. That tendency is indicator-redundancy: separate studies give the same answer when they share the same price, volume, or timing inputs.
The archive records a stack that pairs a stochastic oscillator with parabolic overlays and uses a moving average both on price and as the oscillator signal line. An editorial reading for TradersWeek treats that design as a redundancy test rather than as proof that three studies are better than one.
Three questions on the same bar
Editorial assignment for TradersWeek gives each study one question about the same bar.
A stochastic oscillator is a bounded momentum reading that places the latest close inside a lookback range and can be paired with a short moving-average signal line. It is kept for state.
A moving average is a smoothed average of an ordered series, used here both on price and as the signal line of the oscillator. It is kept for confirmation of the period line, not as a second copy of state.
Parabolic SAR is a trailing overlay that marks dots above or below the price bar as a directional location and stop-style condition. It is kept for location, not as another state study.
The documented pair and the high-state zone
The documented primary pair is a stochastic oscillator parameterized as 12, 1, 3 and parabolic overlays parameterized as 0.07 and 0.2. In that stochastic setup the first value is a 12-unit lookback, the middle smoothing factor is left at 1, and the third value is a 3-period simple moving average of the period line.
A rising-price reading is defined as the 12-period line sitting above its 3-period simple moving average. A falling-price reading is the reverse alignment.
When the period reading is 78 or higher, its position versus the 3-period average is treated as secondary because the oscillator can remain elevated for a long stretch with little variance. That elevated region is the high-state zone.
A scan-filter for long and short candidates
A scan-filter is a boolean rule that ranks long or short candidates from oscillator level and its relation to a short average. One long-candidate rule keeps names where the 12,1 stochastic is above 78, or is below 78 and still above its 3-period average. Sell or short candidates are produced by reversing those directional comparisons.
How the accompanying chart is arranged
The accompanying chart places simple moving averages on price, parabolic dots above and below the bars, and the stochastic oscillator beneath with its 3-period average as a second line.
An editorial reading is that this layout is a check, not a decoration. If the price averages, the parabolic dots, and the oscillator stack all repeat one reading, the extra studies are redundant on that bar.
SPY daily close against the 8-day, 16-day and 50-day averages
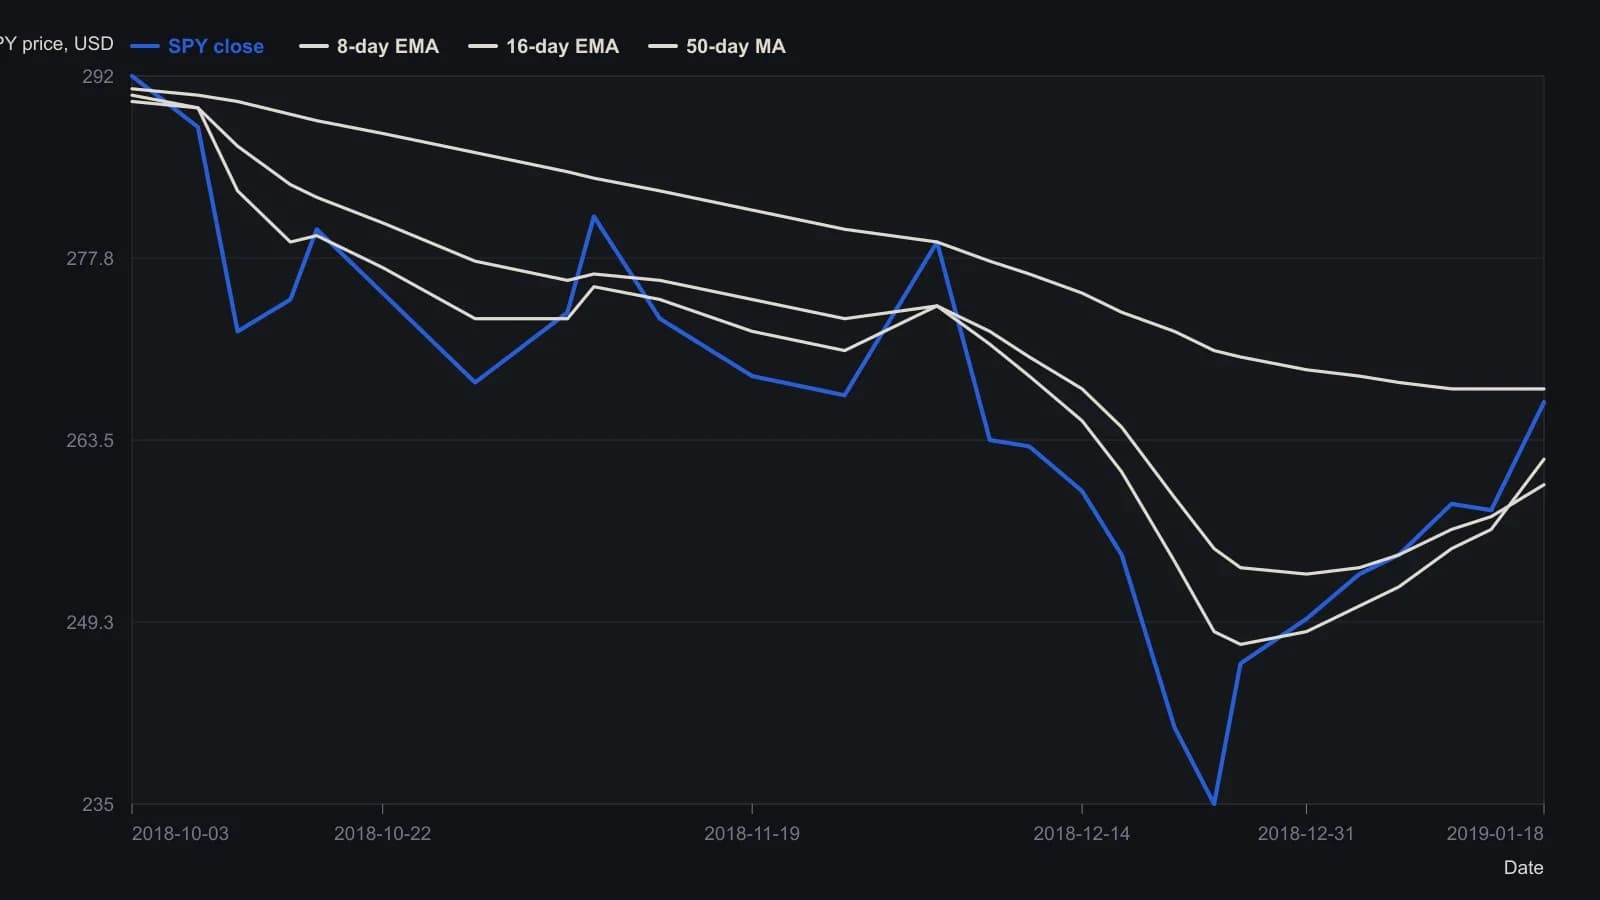
The source also plots Parabolic SAR (step 0.07, maximum 0.20) and a 12,1,3 stochastic that ends at 97.77. Those are omitted here: SAR is a flip-dot overlay, and the oscillator uses a 0–100 scale. Digitized points are rounded to half a point except the labeled last close. Visible range high/low printed on the scale are 293.44 and 231.65.
All readings on this track · 21 readings
- 1987Constructing parabolic stops and cycle-window averages
- 1989Evaluating always-in parabolic SAR trailing stops
- 1993Constructing parabolic time-price trailing stops
- 1995Constructing parabolic SAR as an accelerating trail
- 1995Constructing a noise-buffered parabolic trailing stop
- 1997Constructing a parabolic trailing stop that only tightens
- 1998Triangle breakouts filtered by an exponential average and exited with parabolic stops
- 2000Treat volume-price imbalance as a hypothesis and let Parabolic SAR hold the exit
- 2002Constructing volatility stops from average true range and parabolic SAR
- 2002Parabolic SAR construction from stop outputs to reversal signals
- 2002Always-in-market SAR trail with directional confirmation
- 2004Forex trend confirmation with Average Directional Index, Parabolic SAR, and trendlines
- 2006Permission and fill gates for mechanical systems
- 2008A Relative Strength Index channel for profit lock and a trailing stop for capital protection
- 2010Building loss limits from the parabolic stop-and-reverse plot
- 2015Dual-zone currency indexes filter parabolic SAR signals
- 2016A parabolic trailing stop is not a complete system
- 2019Assigning jobs in a stochastic, parabolic, and moving-average stack
- 2019A three-filter stack as a redundancy test
- 2020Mechanical Parabolic SAR as an always-in flip after a breakout
- 2020Layering Relative Strength Index, MACD, and Parabolic SAR onto relative rotation maps