2004issue C091-5
Forex trend confirmation with Average Directional Index, Parabolic SAR, and trendlines
A historical workflow treats trendline analysis as the first decision about whether a trend exists, uses the directional movement system to confirm that reading, and applies Parabolic SAR only after the Average Directional Index shows that a trend is present.
- A trend is a predictable response at support or resistance that shifts over time, with uptrends bouncing near support into new highs and downtrends reversing near resistance into new lows.
- Trendline analysis is the first filter: mark the most significant levels on daily or weekly charts, then carry those lines into hourly or four-hour charts.
- The Average Directional Index and the plus and minus directional lines confirm a trendline reading and reduce guesswork about whether a trend is present.
- Parabolic SAR is used only after the Average Directional Index confirms a trend, then the position is exited when trendline and parabolic resistance break and the Average Directional Index stalls.
What counts as a trend
A trend can be defined as a predictable price response at support or resistance that shifts over time. Uptrends bounce near support into new highs. Downtrends reverse near resistance into new lows.
The historical workflow presents a disciplined combination of trendline analysis, the directional movement system, and Parabolic SAR as the method for identifying both short-term and long-term trends and then trading them with a trend-specific plan.
Trendlines before indicators
Trendline analysis is the first step for deciding whether a trend exists, because it focuses attention on the underlying price pattern and filters market noise.
Trendlines are applied first on longer daily or weekly charts and then carried into hourly or four-hour charts. That order identifies the most significant support and resistance before shorter-term levels are marked.
Confirm with directional movement
The directional movement system uses the Average Directional Index plus the plus and minus directional lines to confirm a trend spotted on trendlines and to reduce guesswork about whether a trend is present.
An Average Directional Index reading above 25 is treated as evidence that a market is trending. A reading below 20 is treated as evidence that it is not. A higher reading is treated as a stronger trend.
A buy signal occurs when the plus directional line crosses up through the minus line. A sell signal occurs when the reverse cross occurs. Confirmation can wait until the period extreme in the direction of the cross is later exceeded.
Three entries in the daily example
In the illustrated daily example, an aggressive long is described at a November 12, 2003 resistance-line break. A confirmation long is described at the next-day directional-line cross. A conservative long is described after the extreme-point rule is met the following day.
The same daily example treats the Average Directional Index remaining below 25 until December 2, 2003 as the moment a trend is confirmed and trend-following tools become appropriate.
Daily GBP/USD from the November 2003 breakout through the January 2004 peak
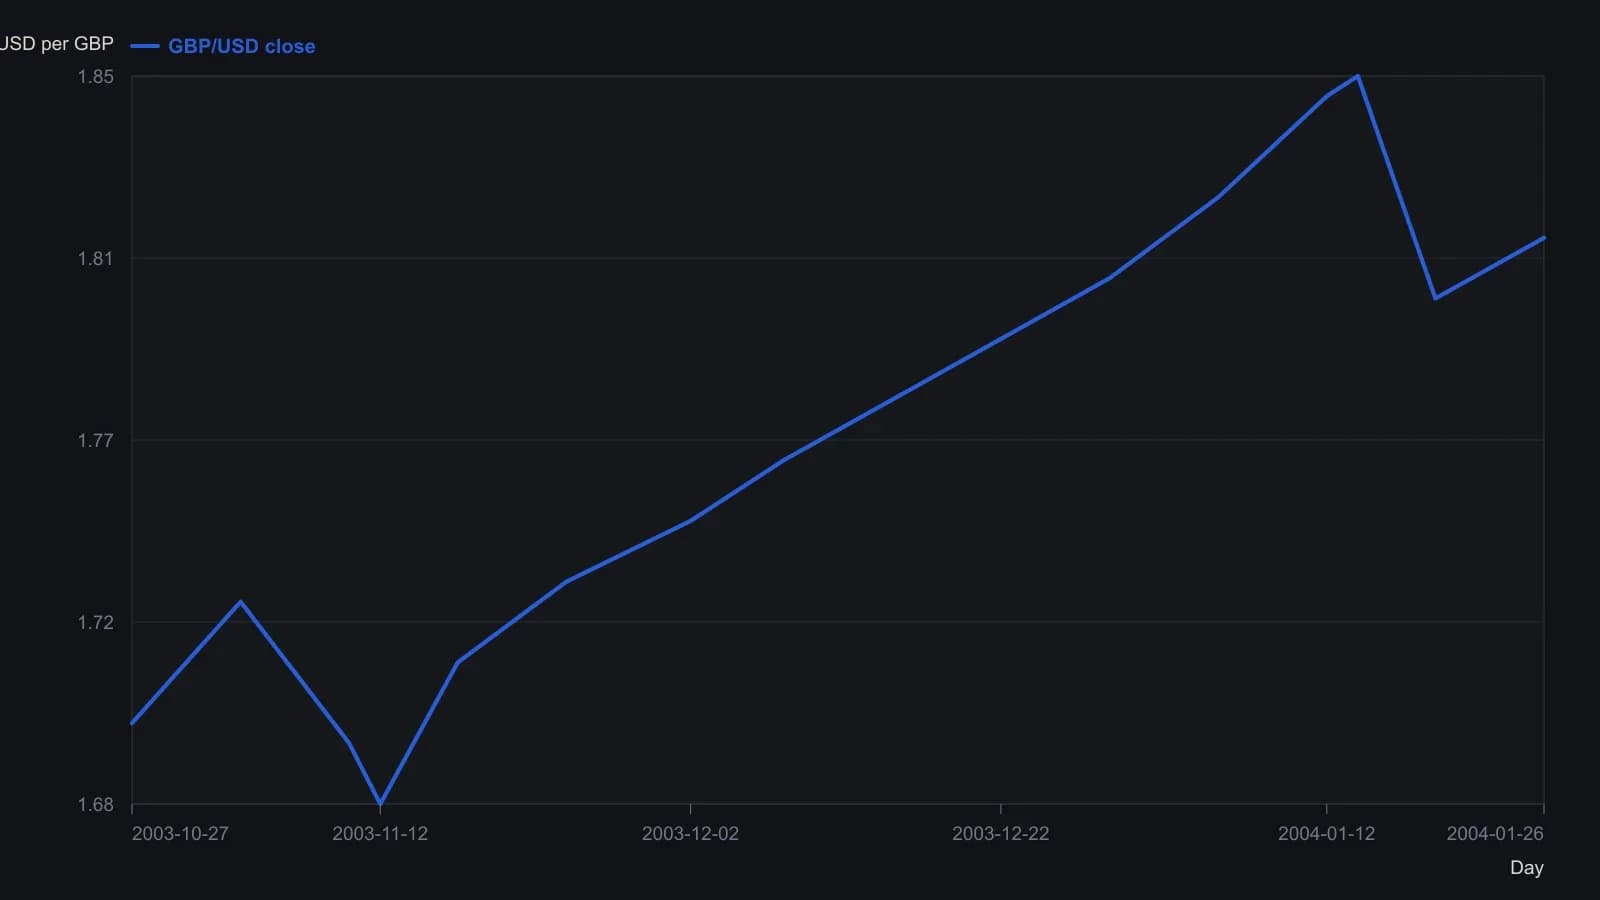
The source printed no price table. Points are approximate weekly closes digitized from the candlestick pane using that printed scale; intra-week swings are not fully resolved and the last digit is not reliable.
Trail only after confirmation
On the illustrated hourly example, a later minus-over-plus directional cross is treated as a short signal. An Average Directional Index rise through 25 is then used as permission to follow Parabolic SAR.
The exit in that example is when trendline and parabolic resistance break and the Average Directional Index stalls. Until that confirmation arrives, the plan stays with the trendline and directional-line evidence rather than a trailing stop.
All readings on this track · 21 readings
- 1987Constructing parabolic stops and cycle-window averages
- 1989Evaluating always-in parabolic SAR trailing stops
- 1993Constructing parabolic time-price trailing stops
- 1995Constructing parabolic SAR as an accelerating trail
- 1995Constructing a noise-buffered parabolic trailing stop
- 1997Constructing a parabolic trailing stop that only tightens
- 1998Triangle breakouts filtered by an exponential average and exited with parabolic stops
- 2000Treat volume-price imbalance as a hypothesis and let Parabolic SAR hold the exit
- 2002Constructing volatility stops from average true range and parabolic SAR
- 2002Parabolic SAR construction from stop outputs to reversal signals
- 2002Always-in-market SAR trail with directional confirmation
- 2004Forex trend confirmation with Average Directional Index, Parabolic SAR, and trendlines
- 2006Permission and fill gates for mechanical systems
- 2008A Relative Strength Index channel for profit lock and a trailing stop for capital protection
- 2010Building loss limits from the parabolic stop-and-reverse plot
- 2015Dual-zone currency indexes filter parabolic SAR signals
- 2016A parabolic trailing stop is not a complete system
- 2019Assigning jobs in a stochastic, parabolic, and moving-average stack
- 2019A three-filter stack as a redundancy test
- 2020Mechanical Parabolic SAR as an always-in flip after a breakout
- 2020Layering Relative Strength Index, MACD, and Parabolic SAR onto relative rotation maps