1999issue C121-6
Squaring charts for Gann angles
A chart is squared by placing price and time on a uniform 1-to-1 grid so they occupy equal visual proportions. Gann angles drawn on that grid can mark Support and resistance and later intersections in price and time.
- Squaring a chart places one price unit on the vertical axis for one bar or day on the horizontal axis so price and time occupy equal visual proportions.
- That scaling step is a Time-price square and is a different procedure from drawing Gann squares that contain a numerical sequence used to project swing points.
- A 45-degree 1x1 Gann angle is drawn through opposite corners of a square on the grid, and related angles such as 1x2, 1x3, 1x4, and 1x8 follow from the same squares.
- Once the chart is squared, correctly applied Gann angles do not change with later scale adjustments and can mark Support and resistance plus later intersections in price and time.
Square price and time first
A chart can be squared by placing price and time on a uniform 1-to-1 grid, meaning one price unit on the vertical axis for one bar or day on the horizontal axis.
Squaring a chart is a scaling step that makes price and time occupy equal visual proportions. It is a different procedure from drawing Gann squares that contain a numerical sequence used to project swing points.
Building a 1-by-1 grid by hand
On a squared hand chart, a 1-by-1 grid can be built bar by bar. A five-point daily range occupies five vertical squares, the next day occupies one horizontal square, and later bars are placed relative to the prior close and range.
Drawing the 1x1 and related Gann angles
A 45-degree 1x1 Gann angle can be drawn on a squared chart by lining a straightedge through opposite corners of a square. Related angles such as 1x2, 1x3, 1x4, and 1x8 follow from the same grid.
Support and resistance on the squared grid
Once a chart is squared, correctly applied Gann angles do not change with later scale adjustments and can mark Support and resistance and later intersection points in both price and time.
Archive illustrations
In the September wheat example, price tracked a 1x1 angle into a later bounce, and equidistant angles drawn after that low identified the reaction as the center of the downtrend's progress.
Gann lines drawn from earlier pivot points can later act as Support and resistance at several locations, as illustrated when S&P futures rebounded from historical highs.
Wheat daily prices, September 1998–August 1999
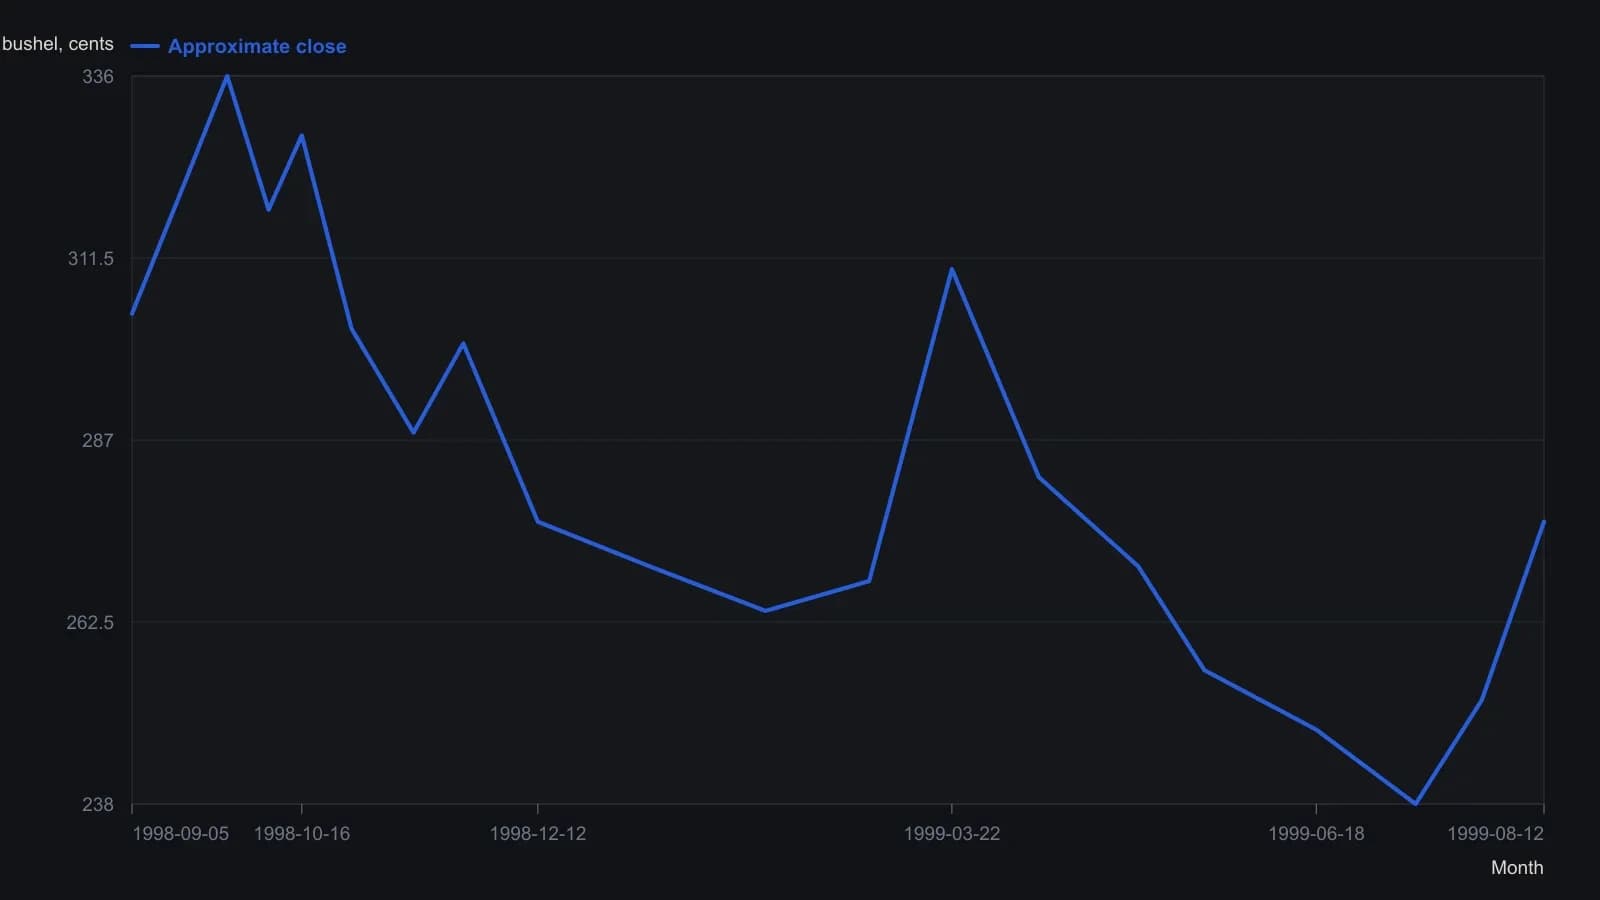
Swing points only; rounded to a few cents because the raster cannot carry tick-level prints.
All readings on this track · 12 readings
- 1988Four sugar-futures turns as a ranked wave-ratio audit
- 1989Cluster-first construction of change-in-trend days from two ratio families
- 1992Wheat bull leg from a squared counterswing and Gann angles
- 1999Log-spiral wave construction from seed pivots
- 1999Compound pivots and market symmetry
- 1999Squaring charts for Gann angles
- 2007Constructing Gann time-price squares, angles, and 144 grids
- 2010Constructing Gann angles to square price and time
- 2011How a Lucas time series is built onto an Elliott wave map
- 2013Time-price boxes for wave-four construction
- 2016Gann circle eighths, Fibonacci neighbors, and time-price squares
- 2016Constructing wave cycles, Fibonacci spans, and time-price squares