2004issue C111-5
TRIX momentum and fundamental overlays for medium-term stock selection
Medium-term stock selection is taught here as three gates: a TRIX timing model, rule-based entry filters on first-week momentum and oscillator location, and a fundamental overlay that keeps only financially healthy names.
- Editorial reading: treat medium-term stock selection as three gates, beginning with a TRIX timing model, then rule-based entry filters, then a fundamental overlay.
- The historical workflow timed buys and sells with TRIX and signal-line events labeled bounce, golden cross, fall, and dead cross, using paired points for distributed entries and exits.
- Entry grouping preferred a stronger first-week rise, a lower TRIX level, and a bounce with TRIX already above its signal line.
- A further screen kept only names with assets above liabilities and an upward trend in revenues and earnings per share.
Three gates for medium-term selection
Editorial reading: medium-term stock selection can be taught as a three-gate procedure rather than as a single indicator. The first gate is a TRIX timing model. The second gate applies rule-based entry filters to first-week momentum and to where TRIX sits relative to its signal line. The third gate is a fundamental overlay that keeps only financially healthy names.
The archive facts below describe a historical workflow. They do not prescribe a live portfolio.
TRIX timing events
The historical workflow defined buy and sell timing with TRIX and signal-line events labeled bounce, golden cross, fall, and dead cross. Entries were distributed across paired B1 and B2 points. Exits were distributed across paired S1 and S2 points.
Weekly Nasdaq Composite observations were used to test how first-week rise, TRIX level, and TRIX-versus-signal location related to subsequent return after a buy signal.
Rate of return was measured as the change from the buy-week close to the highest close before or at the sell signal. The measure did not adjust for holding time or interest.
Rule-based entry filters
First-week rise observations were grouped by size. Negative first-week rises were dropped because they were judged unlikely to produce a winning trade. After grouping, higher first-week rise corresponded to higher average return, so the workflow preferred names that already showed a stronger weekly rise when the buy signal appeared.
When the same buy signals were grouped by TRIX value, lower TRIX at entry corresponded to higher average return. The archive interpreted that pattern as more room after a corrective drop.
A location measure compared TRIX to its signal line. Grouped averages favored a bounce with TRIX already above the signal, then a bounce from below, over less favorable TRIX versus signal geometries.
A fundamental overlay
A fourth screen required assets above liabilities and an upward trend in revenues and earnings per share. The aim was to avoid pairing a technically healthy setup with a deteriorating balance sheet.
Nasdaq Composite weekly path, late 1995 through April 2004
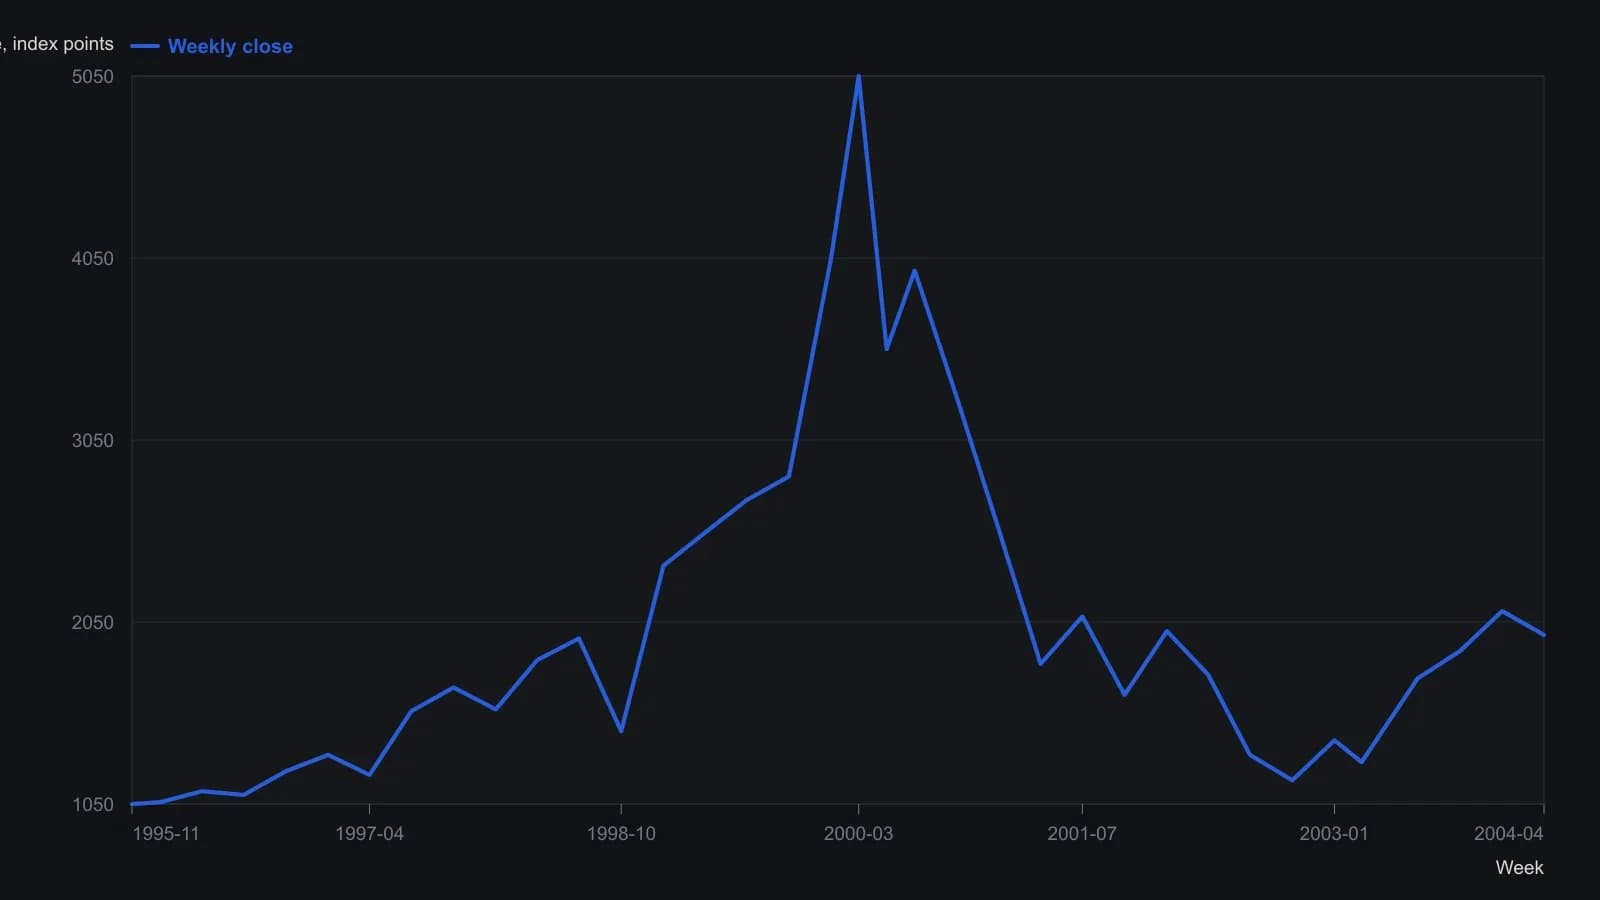
Sampled about quarterly from the weekly candlestick raster. Except for the labeled last print 1978.62, levels are nearest-10 visual readings and are approximate.
All readings on this track · 15 readings
- 1984Constructing TRIX from a cutoff to one shared alpha
- 1988Isolate nested formulas before judging signals
- 1992Constructing TRIX from triple exponential smoothing
- 1992Constructing a TRIX oscillator from daily declines
- 1992A pre-trade checklist that stays flat until weekly support and TRIX agree
- 1992Constructing TRIX as triple-smoothed log-price momentum
- 1992Building TRIX crossover and momentum entries on a period grid
- 1992TRIX lookback and momentum derivative parameters
- 1994Seeding TEMA and DEMA with time-trend regression
- 1997Constructing the TRIX oscillator from triple smoothing
- 2002Constructing TRIX from triple-smoothing to signal rules
- 2002Lock the TRIX construction before reading a zero-line cross
- 2003Constructing TRIX from nested exponential averages
- 2004Construct TRIX entry, exit, and rest windows as one recipe
- 2004TRIX momentum and fundamental overlays for medium-term stock selection