2015issue C0722-25
Elliott wave classifies the swing; trend following holds the trade
Editorial view: give Elliott wave only the job of naming the present swing as an impulsive-phase or a corrective-phase, then let a trend-following-hold decide duration, so mean-reversion tools never pull a position out of a one-sided-market.
- Elliott wave is limited to naming the present swing as an impulsive-phase or a corrective-phase, not to calling the next reversal.
- Once that regime-filter agrees with the larger direction, a trend-following-hold stays in until price itself becomes trendy the other way.
- Oscillators, bands, envelopes, and an implied-volatility fear gauge were treated as mean-reversion tools that fail inside a one-sided-market.
- The combined procedure stands aside without trendy Elliott wave structure, as in the first eight months of the yen-trust example, then enters only after the countertrend pattern ends.
Give each method one job
Editorial view: a combination system should split the work. Elliott wave answers only whether the present swing is an impulsive-phase or a corrective-phase. Trend following answers only how long to stay once that classification agrees with the larger direction.
The point of the split is narrow. Mean-reversion tools then never become a reason to leave a one-sided-market.
A stretch treated as outside any stable normal
From the late 1990s through the mid-2010s, successive episodes were treated as outside any stable normal. A major growth index roughly doubled in a year. Blue-chip indexes lost about half their value in less than three years. An advance from the 2003 low took about four years to double. A late-2007 to early-2009 crisis decline followed, and a bull market was already older than six years by the 2015 discussion.
The so-called new market normal was defined as unusually large, fast, and one-sided swings rather than a return to a mean-reverting baseline. Editorial reading: that definition treats a one-sided-market as the working regime, not as a brief excess that must snap back.
Mean-reversion tools lose their footing
Oscillators such as stochastics and RSI, band and envelope constructs, and an implied-volatility fear gauge were presented as mean-reversion tools that become unreliable when markets stay one-sided. The accompanying volatility chart was captioned as showing low readings during some of the largest advances.
Price was treated as the single persistently reliable input. Extra indicators and algorithms were described as noise that can interrupt a valid trend or stop working after a temporary stretch of usefulness. That is the price-first-input stance: the raw price path is the decision variable, not a derived oscillator or envelope.
Daily VIX, 1990 to February 2015
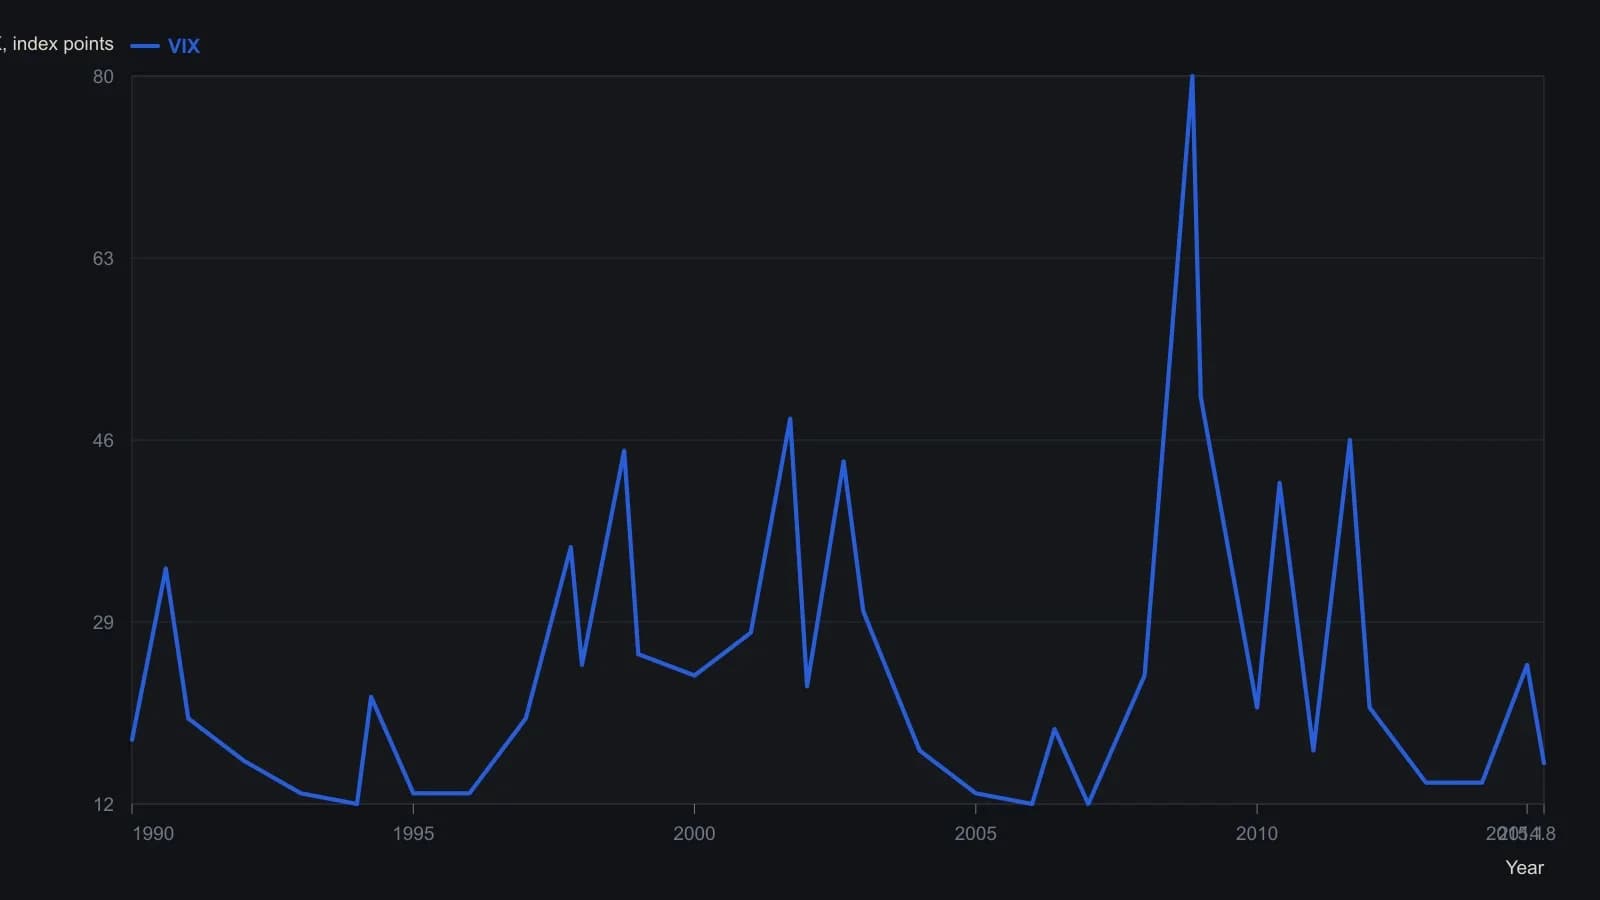
The source VIX scale is logarithmic. Spike heights and intra-year timing are approximate raster readings; only the 15.81 last is printed as a number.
Elliott wave names the present regime
Elliott wave analysis was framed as a price-structure method for classifying an impulsive-phase versus a corrective-phase. Its usable value was limited to identifying the present regime rather than anticipating the next reversal.
Editorial reading: that limited job is the regime-filter. It decides whether current structure is trendy enough to justify a trend-following entry. It does not name where the swing should end.
Trend following stays until price turns
Trend following was defined as a price-only procedure that measures trendiness and participates via breakouts. Those breakouts include new 10-day, 20-day, or 55-day highs, a sudden acceleration in price, or a moving-average cross. The same procedure remains exposed to repeated false-breakout signals.
The combined procedure takes a position only when a trendy Elliott wave pattern is unfolding in the direction of the apparent larger trend. Management then passes to a trend-following-hold. The exit comes only after price reverses into trendy behavior the other way.
While price continues to move in a trendy fashion in the trade direction, exits based on a volatility trough, a negative indicator divergence, or an arbitrary price target were rejected.
The yen-trust example
In the yen-trust example, the first eight months of 2014 were treated as lacking trendy Elliott wave structure and produced no trade. That stretch was read as a corrective-phase, and a short was opened only after the countertrend pattern ended.
The short was then held under the trend-following-hold. Editorial reading: abstention is part of the procedure, not a gap in it. The regime-filter can keep the book empty until structure and the larger direction agree.
All readings on this track · 26 readings
- 1984Three-gate confirmation for wave, ratio, and cycle turns
- 1988Triaging Elliott wave counts with weekly stochastic divergences
- 1989Dominant-cycle phase flips as regime tests
- 1989Audit signals against elasticity regimes
- 1990When wave counts fail the exclusion test
- 1991Evaluating hourly DJIA growth-rate and velocity attractors
- 1996If a terminal fifth is rewritten, fail the first count
- 1998Mapping industrial-average swings with Fibonacci growth and retracements
- 1999Define the stop before the wave or the divergence
- 2001Form-first Elliott wave construction with phi
- 2006Wave count, channel floor, and Fibonacci bands after a correction
- 2007Impulse and correction as a recursive fractal recipe
- 2008Gold-silver ratio as a shoreline wave
- 2008A daily chart trend filter with Elliott wave abstention
- 2010Revising Elliott wave counts with RSI and stochastic guides
- 2010Constructing corrective-wave hypotheses with Fibonacci retracements
- 2011Pre-commit the wave-and-ratio stop before entry
- 2012Dated wave and ratio cases need a later-sample test
- 2013Keep a 1-2-3 count only while zigzag, Fibonacci depth, and divergence still agree
- 2014Elliott-wave target versus the option bid-ask
- 2014A three-layer classroom on one daily futures chart
- 2015Elliott wave classifies the swing; trend following holds the trade
- 2016Constructing wave labels and retracement zones from chart structure
- 2017Sector ETF pairs in quiet regimes
- 2017A policy-shift case that tested a delayed long-cycle wave count
- 2018One role each for wave, Fibonacci, and stochastic