2013issue C0610-19
Keep a 1-2-3 count only while zigzag, Fibonacci depth, and divergence still agree
Editorial classroom drill: a 1-2-3 label stays in force only while a high-low zigzag still confirms the swing, Fibonacci wave-2 depth still allows wave 2, and divergence type still matches continuation rather than reversal.
- Keep a 1-2-3 label only while the high-low zigzag still confirms the swing, Fibonacci wave-2 depth still allows the correction, and divergence type still matches the intended story.
- HLPivot can be a percent change, an ATR-scaled factor, or the sum of both, and those zigzag swings are what the count is allowed to mark.
- A retrace beyond 100 percent of wave 1, or a move beyond the origin of the prior wave 1 or 3, invalidates wave 2 and forces a 2>1 relabel.
- Regular divergence at a new 1-2-3 start is a reversal cue, while hidden divergence at the start of wave 3 is a continuation cue.
What the 1-2-3 wave count marks
The 1-2-3 wave count describes a directional move as a first impulse, a smaller correction, and a third swing that continues past the first swing high or low.
Each labeled wave may contain a lower-degree 1-2-3. That fractal nesting also reuses a completed wave-3 extreme as a new wave-1 origin, so later extensions can be numbered 3.1, 3.2, and so on.
Mark swings with a high-low zigzag
Swings used for that count can be marked with a high-low zigzag whose reversal threshold is a percent change, an ATR-scaled factor, or the sum of both. That reversal amount is the HLPivot.
If the ATR factor is zero, the reversal threshold uses only the percent setting. If the percent setting is zero, it uses only ATR. Otherwise the two terms are added.
One illustrated zigzag example requires a 3 percent price change plus a three-period ATR multiplied by 1.5. Listed defaults include a 5 percent threshold, a 5-period ATR lookback, and a 1.5 ATR factor.
Judge wave 2 by Fibonacci depth
A smaller wave-2 correction is framed as a 23.6 percent to 50 percent Fibonacci retracement of wave 1. A larger correction may reach 76.4 percent. A deeper move is treated as a warning. A retrace beyond 100 percent of wave 1 invalidates the wave-2 label.
Read divergence as reversal or continuation
Regular price-indicator divergence at the start of a new 1-2-3 is treated as a reversal cue. Regular divergence is price making a new extreme while the indicator fails to confirm.
Hidden divergence at the start of wave 3 is treated as a continuation cue. Hidden divergence is price making a higher low or lower high while the indicator moves the other way.
Rewrite the count when the third swing fails
If wave 2 travels beyond the origin of the prior wave 1 or 3, the label is rewritten as a new wave 1. That invalid wave 2 is the 2>1 relabel: a failed correction becomes the first wave of a move in the opposite direction.
If an expected wave 3 fails to make a new extreme after the zigzag confirms a turn, the prior wave 2 becomes wave 1 and the failed third swing becomes wave 2. That incomplete wave 3 is rewritten rather than forced to fit the old count.
An exception keeps the prior swing as wave 2 when price then makes a new wave-3 extreme. That extreme is numbered as the next wave-3 sequence instead of locking in a reversal count.
Tell a small wave 2 from a larger 1-2-3
Checks used to decide whether a counter-move is only a small wave 2 or a larger 1-2-3 include a 161.8 percent projection of a completed 3.1 at the 3.2 extreme, a 261.8 percent projection from wave 2 near volatility-band support, and a negative price-indicator divergence.
GT daily close against the 261.8 percent Fibonacci support
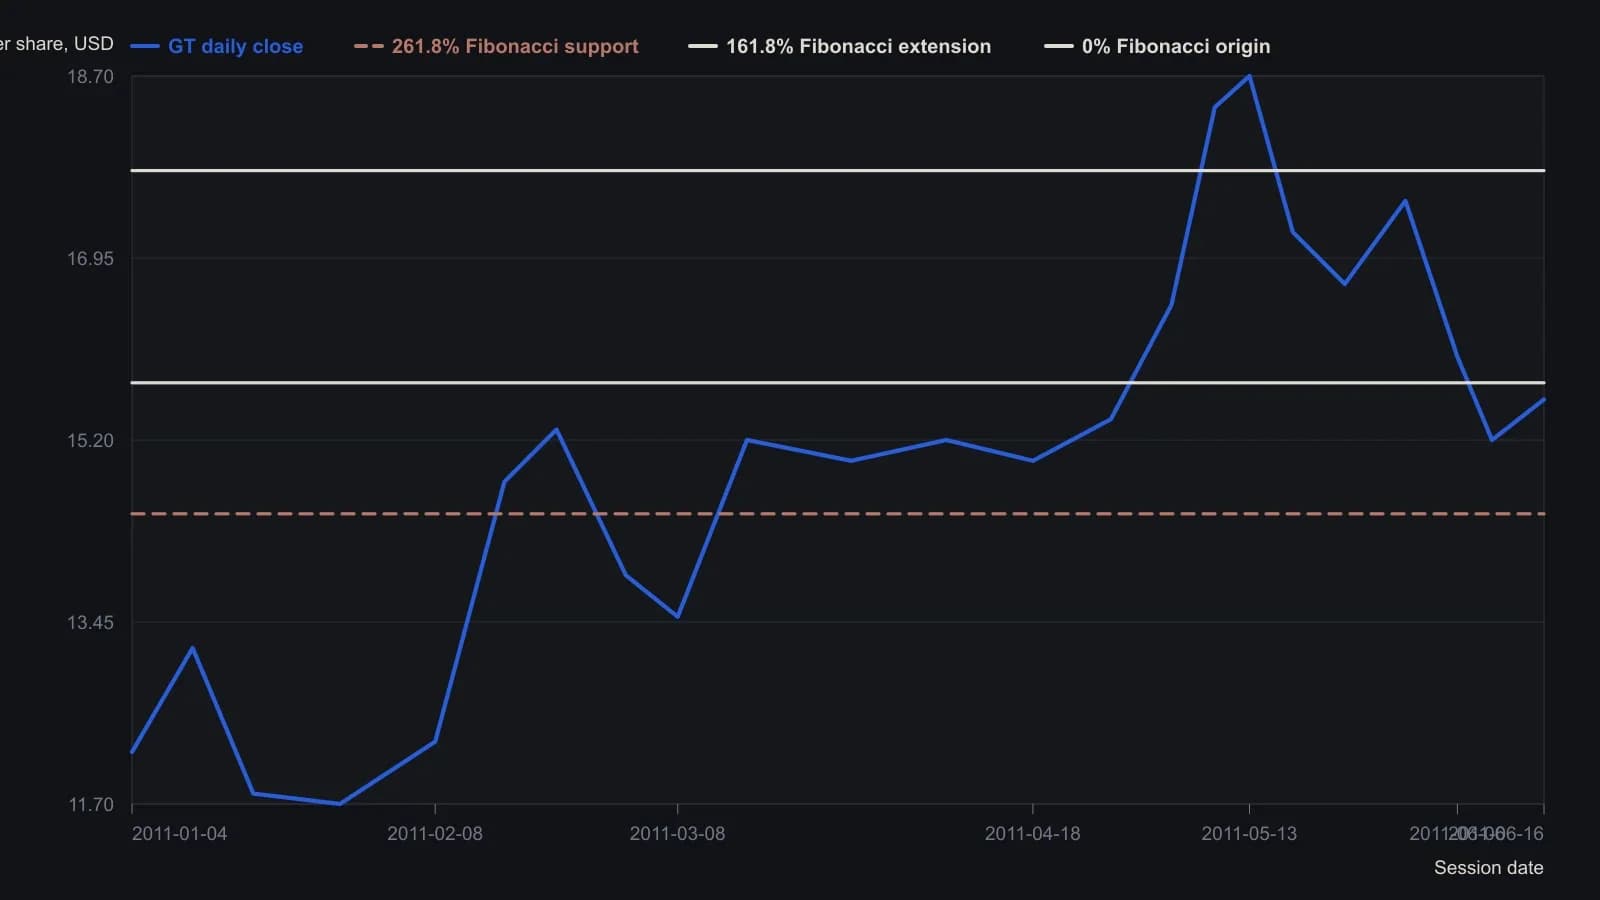
Closes are approximate to about a tenth of a point because they were read off the raster. The last close 15.59 and the Fibonacci prints 17.79, 15.75 and 14.49 are the labels on the figure. Those Fibonacci targets are projected from wave 2 on daily GT bars.
All readings on this track · 26 readings
- 1984Three-gate confirmation for wave, ratio, and cycle turns
- 1988Triaging Elliott wave counts with weekly stochastic divergences
- 1989Dominant-cycle phase flips as regime tests
- 1989Audit signals against elasticity regimes
- 1990When wave counts fail the exclusion test
- 1991Evaluating hourly DJIA growth-rate and velocity attractors
- 1996If a terminal fifth is rewritten, fail the first count
- 1998Mapping industrial-average swings with Fibonacci growth and retracements
- 1999Define the stop before the wave or the divergence
- 2001Form-first Elliott wave construction with phi
- 2006Wave count, channel floor, and Fibonacci bands after a correction
- 2007Impulse and correction as a recursive fractal recipe
- 2008Gold-silver ratio as a shoreline wave
- 2008A daily chart trend filter with Elliott wave abstention
- 2010Revising Elliott wave counts with RSI and stochastic guides
- 2010Constructing corrective-wave hypotheses with Fibonacci retracements
- 2011Pre-commit the wave-and-ratio stop before entry
- 2012Dated wave and ratio cases need a later-sample test
- 2013Keep a 1-2-3 count only while zigzag, Fibonacci depth, and divergence still agree
- 2014Elliott-wave target versus the option bid-ask
- 2014A three-layer classroom on one daily futures chart
- 2015Elliott wave classifies the swing; trend following holds the trade
- 2016Constructing wave labels and retracement zones from chart structure
- 2017Sector ETF pairs in quiet regimes
- 2017A policy-shift case that tested a delayed long-cycle wave count
- 2018One role each for wave, Fibonacci, and stochastic