2017issue C0642-46
Sector ETF pairs in quiet regimes
In a consolidating tape, day-to-day sector oscillation can be framed as a long-short-combo rather than as an unhedged single-fund swing. Historical notes treated opposite opening gaps and a spread-discount-premium as pair hypotheses, with a relative-strength-screen and an rsi-moving-average-anchor sitting beside that work as listing and caution tools.
- Sector-rotation-noise during consolidation can be taken as a relative trade between sector funds, which the archive presented as a smoothing-effect next to an unhedged single-sector swing.
- Pairing financials with utilities was offered as a higher-opportunity, higher-risk spread than financials with industrials, because the utilities vehicle had historically the lowest correlation to the broad-market proxy.
- Opening gaps that send sector funds in opposite directions were treated as mean-reverting pair entries that use opening-gap-liquidity, with a planned hedge if the shock continues.
- A relative-strength-screen listed exchange-traded funds across several lookbacks and versus a chosen moving average, while an rsi-moving-average-anchor marked when the industrial average stretched far above a long-lookback average of the oscillator.
Relative trades when the index is still
During consolidating markets, day-to-day sector oscillation can be framed as a relative trade of one sector fund against another rather than as an unhedged single-fund swing. That sector-rotation-noise is the motion a long-short-combo is meant to harvest. The archive presented the hedged path as showing a smoothing-effect next to a single-sector swing.
Editorial reading: a quiet, range-bound tape is a laboratory for those relative trades. The task is to map which sector pairs have historically absorbed macro rotation, then write the repeatable chart condition as a falsifiable pair hypothesis instead of as a forecast of the next index trend.
Which pairs carry the rotation
Among the sector funds discussed, the utilities vehicle was described as having historically the lowest correlation to the broad-market proxy, so pairing it against financials was presented as a higher-opportunity, higher-risk spread than pairing financials against industrials.
A discounted financials-versus-utilities relationship was offered as a long-financials, short-utilities hypothesis. That spread-discount-premium could be sized by capital, average-true-range, or a hybrid rule. The archive expected the idea to be worked through both intraday reversals and short multi-day swings, which matches a do-some-hold-some exit: harvest the fast mean reversion in the session and leave a residual if the dislocation lasts.
Consumer staples versus consumer discretionary was described as a near-recurring risk-on-risk-off-pair. The staples fund usually offered a more defensive posture even though the two often move together.
Gaps, limits, and a planned hedge
Opening gaps that separate sector funds in opposite directions were treated as mean-reverting pair entries, on the observation that the spread often narrows as conditions change over the same session or several days. That is opening-gap-liquidity: the first print after an overnight news shock, where a limit at the open can take the other side of crowded sentiment without chasing later prints.
A defense contractor opened at a clear premium after missile-strike news, then retraced enough to fill a substantial part of that opening gap. A filled opening-limit short of that premium was presented with optional hedges in the broad-market proxy, the industrials sector fund, or another defense name, so the short of the crowded print could stand while a preplanned lean remained if the shock continued. That is contrarian-liquidity-provision: offer size at the open against a gap-driven crowd, then lean on a hedge if the shock persists.
The column argued that many automated participants skip the opening print, leaving room for a human trader to place a contrary opening-limit.
Screens beside the pair work
A companion product note described a relative-strength-screen of exchange-traded funds across several lookbacks, and by whether price sits above or below a chosen simple or exponential moving average or a two-average crossover.
A separate chart note treated a long-lookback moving average of the relative-strength index as an rsi-moving-average-anchor. When the industrial average stretched far above that average of the oscillator, the series was described as inclined to fall back toward it, without a fixed rule for how far the stretch can go.
Editorial reading: the screen lists names; the oscillator average is a caution line. Neither replaces the pair hypothesis built from the spread or the gap.
Leading ETFs by six-month total return
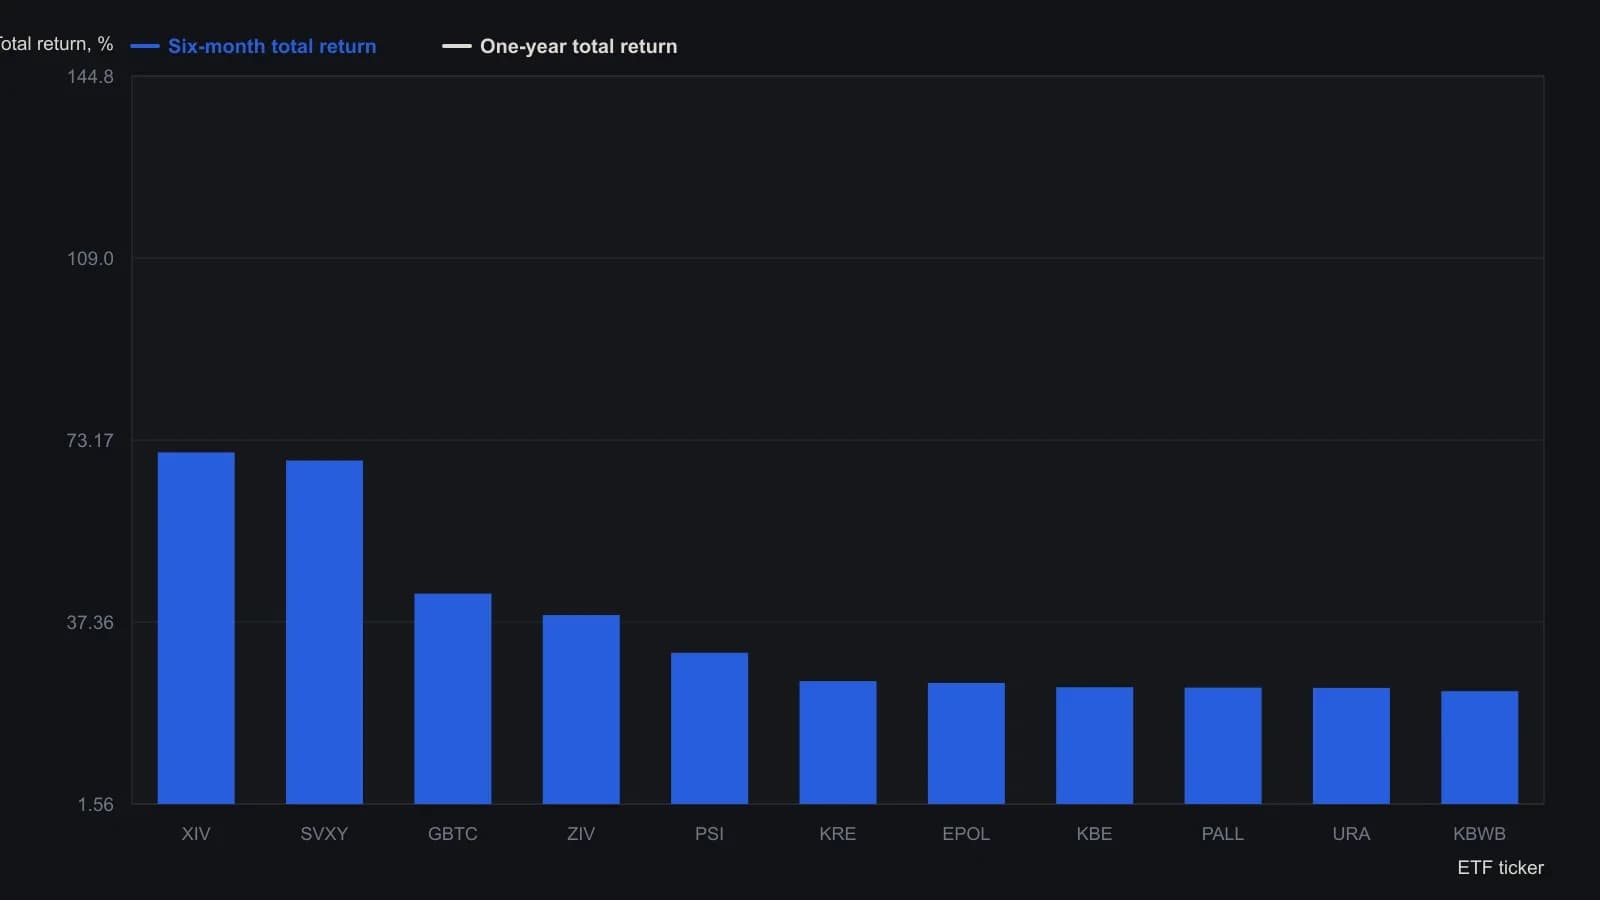
The reviewer left inverse and leveraged products in the universe and sorted the six-month column descending. Returns are total return (price plus dividends) as the review defines them.
All readings on this track · 26 readings
- 1984Three-gate confirmation for wave, ratio, and cycle turns
- 1988Triaging Elliott wave counts with weekly stochastic divergences
- 1989Dominant-cycle phase flips as regime tests
- 1989Audit signals against elasticity regimes
- 1990When wave counts fail the exclusion test
- 1991Evaluating hourly DJIA growth-rate and velocity attractors
- 1996If a terminal fifth is rewritten, fail the first count
- 1998Mapping industrial-average swings with Fibonacci growth and retracements
- 1999Define the stop before the wave or the divergence
- 2001Form-first Elliott wave construction with phi
- 2006Wave count, channel floor, and Fibonacci bands after a correction
- 2007Impulse and correction as a recursive fractal recipe
- 2008Gold-silver ratio as a shoreline wave
- 2008A daily chart trend filter with Elliott wave abstention
- 2010Revising Elliott wave counts with RSI and stochastic guides
- 2010Constructing corrective-wave hypotheses with Fibonacci retracements
- 2011Pre-commit the wave-and-ratio stop before entry
- 2012Dated wave and ratio cases need a later-sample test
- 2013Keep a 1-2-3 count only while zigzag, Fibonacci depth, and divergence still agree
- 2014Elliott-wave target versus the option bid-ask
- 2014A three-layer classroom on one daily futures chart
- 2015Elliott wave classifies the swing; trend following holds the trade
- 2016Constructing wave labels and retracement zones from chart structure
- 2017Sector ETF pairs in quiet regimes
- 2017A policy-shift case that tested a delayed long-cycle wave count
- 2018One role each for wave, Fibonacci, and stochastic