2006issue C091-5
Wave count, channel floor, and Fibonacci bands after a correction
After an ABC correction, lock one alternative Elliott count, convert it into Fibonacci price bands, then let the rising-channel floor decide whether a fifth-wave push toward new cyclical highs is still the live hypothesis.
- Lock one alternative Elliott count first so later Fibonacci bands and support tests refer to the same swing labels.
- Convert that count into equal-wave targets and a wave-five projection so the advance has a defined finish zone.
- Treat the rising-channel floor as the support-resistance line that keeps the fifth-wave hypothesis alive or rejects it.
- Read channel support, candlestick rejection, and Fibonacci bands as one price map rather than as separate opinions.
A single stack for a post-correction advance
A completed correction is easier to test as a hypothesis than as a story. The working stack is short. Lock an alternative Elliott count. Convert that count into Fibonacci price bands. Then let the rising-channel floor decide whether a fifth-wave push toward new cyclical highs is still live.
Editorial reading: TradersWeek uses the mid-2000s S&P 500 chart as a teaching case for that stack. The labels and levels below come from the archive. The claim that they form one falsification sequence is editorial.
The archive counted the rise from the October 2002 lows as an abc-correction, a three-leg countertrend structure in which the third leg is often a measured multiple of the first. Wave A ran from October 2002 to March 2004. Wave B ran from March 2004 to August 2004. Wave C was still unfolding from the 2004 trough.
Lock the alternative Elliott count
Elliott wave analysis is a labeling system that divides an advance into motive and corrective legs so later segments can be compared with earlier ones and treated as a testable count. Once the larger rise is locked as an ABC correction, wave C can be tested as a motive form rather than redrawn on every pullback.
Wave C was described as an ending diagonal, a contracting five-wave motive form whose internal legs typically divide into three-part a-b-c swings. The archive treated each internal leg that way.
After the autumn 2004 wave-B low, the S&P 500 rose inside a trend channel. A trend channel is a pair of parallel boundaries drawn from a completed low that frame an advance and act as a support test on later pullbacks. The lower edge of that channel sat only a few points below the 50-week exponential moving average.
That 50-week average was broken on three later pullbacks. Those breaks were marked as a wave-(2) low in spring 2005, a wave-(3) b-wave low in autumn 2005, and a wave-(4) low in spring 2006. Editorial reading: the labels stay useful only if later price is required to confirm or reject them.
Convert the count into Fibonacci bands
Fibonacci retracement is a ratio overlay that scales a completed swing by 0.618 or 1.618 to mark where a later wave is expected to finish. After the count is locked, those ratios become finish zones for wave C and for a possible fifth wave inside it.
Wave A was measured at about 350 points. From the wave-B low that implied an A-equals-C target of 1425, a doubled-C target of 1775, and a 61.8 percent A-of-C target of 1291.30 that had already been passed.
Treating wave C as a five-wave ending triangle, the archive also built a wave-five-projection: a price range built by adding 1.618 times wave one to the wave-one peak and 0.618 times wave three to the wave-three peak. A 1.618 multiple of the 118-point first wave added to the 1212 weekly close at the wave-1 top produced a lower objective near 1403. A 0.618 multiple of the 232-point third wave added to the 1326 weekly close at the wave-3 top produced an upper objective near 1469. The midpoint of those two bands was 1436, close to the 1425 equal-wave estimate.
Editorial reading: the live finish zone for a fifth-wave push was the overlap of the equal-wave target and the wave-five band, not a later number chosen after price had already moved.
S&P 500 upside bands from the locked ABC count and Fischer wave-5 math
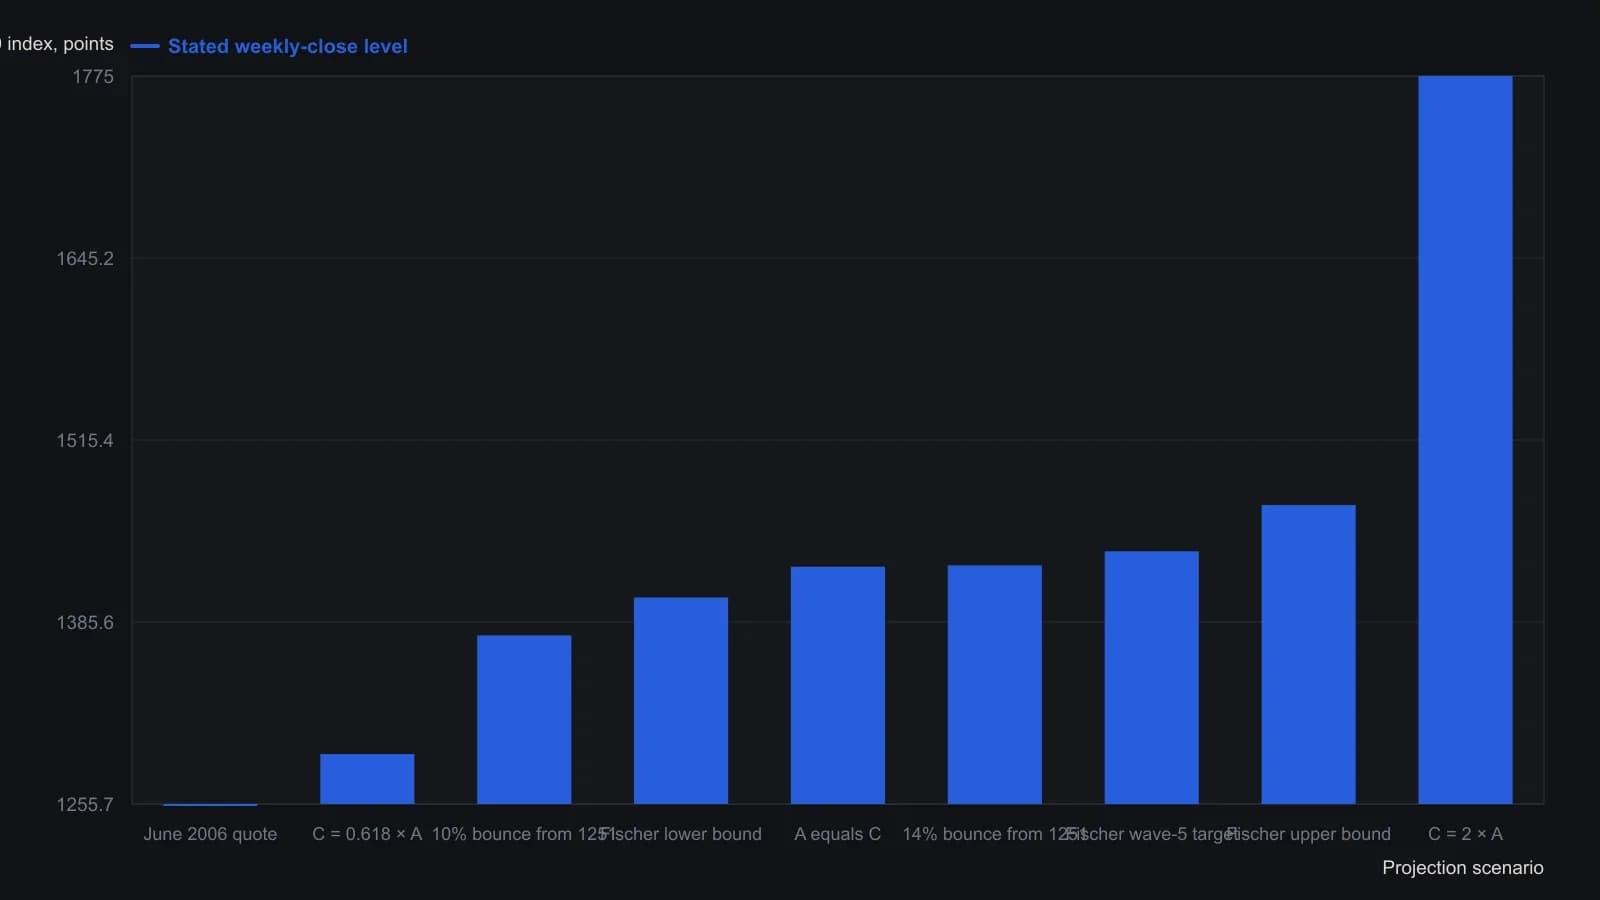
Wave A is fixed at 350 points using 800 as the average of the October 2002 and March 2003 lows and 1150 as the April 2004 top. Fischer’s range uses wave 1 of 118 points to a 1212 weekly close times 1.618, and wave 3 of 232 points to a 1326 weekly close times 0.618. The 10 percent and 14 percent analogs are applied to the 1251 weekly closing low of the week ended 9 June 2006.
Let the channel floor decide
Support and resistance is a price boundary, often a trend-channel edge, that has repeatedly halted declines and can invalidate a wave count if lost. In this stack the rising-channel floor is that boundary.
On the spring 2006 test, the index crossed below the 50-day exponential moving average yet stayed above the channel floor. Weekly candles at the October 2005 and mid-June 2006 lows printed long lower shadows, including a hammer on the latest support test.
Channel support, candlestick rejection at the channel floor, and Fibonacci wave bands were meant to be read together so a summer 2006 push toward new cyclical highs could be confirmed or rejected by the same price map.
Editorial reading: while price holds the channel floor and remains pointed at the 1403 to 1469 band, the fifth-wave hypothesis stays live. A close through the floor rejects that count on the same map that proposed it.
All readings on this track · 26 readings
- 1984Three-gate confirmation for wave, ratio, and cycle turns
- 1988Triaging Elliott wave counts with weekly stochastic divergences
- 1989Dominant-cycle phase flips as regime tests
- 1989Audit signals against elasticity regimes
- 1990When wave counts fail the exclusion test
- 1991Evaluating hourly DJIA growth-rate and velocity attractors
- 1996If a terminal fifth is rewritten, fail the first count
- 1998Mapping industrial-average swings with Fibonacci growth and retracements
- 1999Define the stop before the wave or the divergence
- 2001Form-first Elliott wave construction with phi
- 2006Wave count, channel floor, and Fibonacci bands after a correction
- 2007Impulse and correction as a recursive fractal recipe
- 2008Gold-silver ratio as a shoreline wave
- 2008A daily chart trend filter with Elliott wave abstention
- 2010Revising Elliott wave counts with RSI and stochastic guides
- 2010Constructing corrective-wave hypotheses with Fibonacci retracements
- 2011Pre-commit the wave-and-ratio stop before entry
- 2012Dated wave and ratio cases need a later-sample test
- 2013Keep a 1-2-3 count only while zigzag, Fibonacci depth, and divergence still agree
- 2014Elliott-wave target versus the option bid-ask
- 2014A three-layer classroom on one daily futures chart
- 2015Elliott wave classifies the swing; trend following holds the trade
- 2016Constructing wave labels and retracement zones from chart structure
- 2017Sector ETF pairs in quiet regimes
- 2017A policy-shift case that tested a delayed long-cycle wave count
- 2018One role each for wave, Fibonacci, and stochastic