2008issue C041-3
Gold-silver ratio as a shoreline wave
A roughly 20-year ratio-stretch left the gold-silver ratio at 70 or 80 to 1 against a later average near 30 to 1, while industrial absorption reversed above-ground stock. This editorial case study treats that stretch as one unfinished wave and reads the first sustained narrowing as the shoreline phase.
- The in-ground silver-to-gold quantity ratio is stated as about 17 to 1, yet above-ground stock is described as the reverse because industrial absorption consumes far more mined silver than mined gold.
- A roughly 20-year ratio-stretch left the gold-silver ratio at 70 or 80 to 1, versus a later-period average near 30 to 1.
- With gold at 350 and silver at 5, unchanged gold at 30 to 1 implies silver above 11.60, and at 16 to 1 implies silver near 22, so silver is said to reprice 2.33 times as fast toward the average.
- Editorial reading: the first sustained contraction is the shoreline phase that makes stored imbalance visible, and tests whether silver must reprice faster if gold does not collapse.
Above-ground stock ran the other way
The in-ground silver-to-gold quantity ratio is stated as about 17 to 1. Above-ground inventories are described as the reverse of that in-ground ratio, because industry consumes far more mined silver than mined gold.
That industrial absorption is said to have reduced above-ground silver from about 10 billion ounces in late 1945 into the high millions, with use of an ounce and a half for every ounce mined.
A long ratio-stretch against older bands
A roughly 20-year stretch left the gold-silver ratio at 70 or 80 to 1, versus a later-period average near 30 to 1.
An earlier price-ratio history is given as just under 3 to 1 at the closest, about 16 to 1 at the widest, and about 8 to 12 to 1 on average. The following 130 years are given as about 16 to 1 to about 100 to 1, averaging close to 30 to 1.
Gold-silver price ratio versus the long-run band
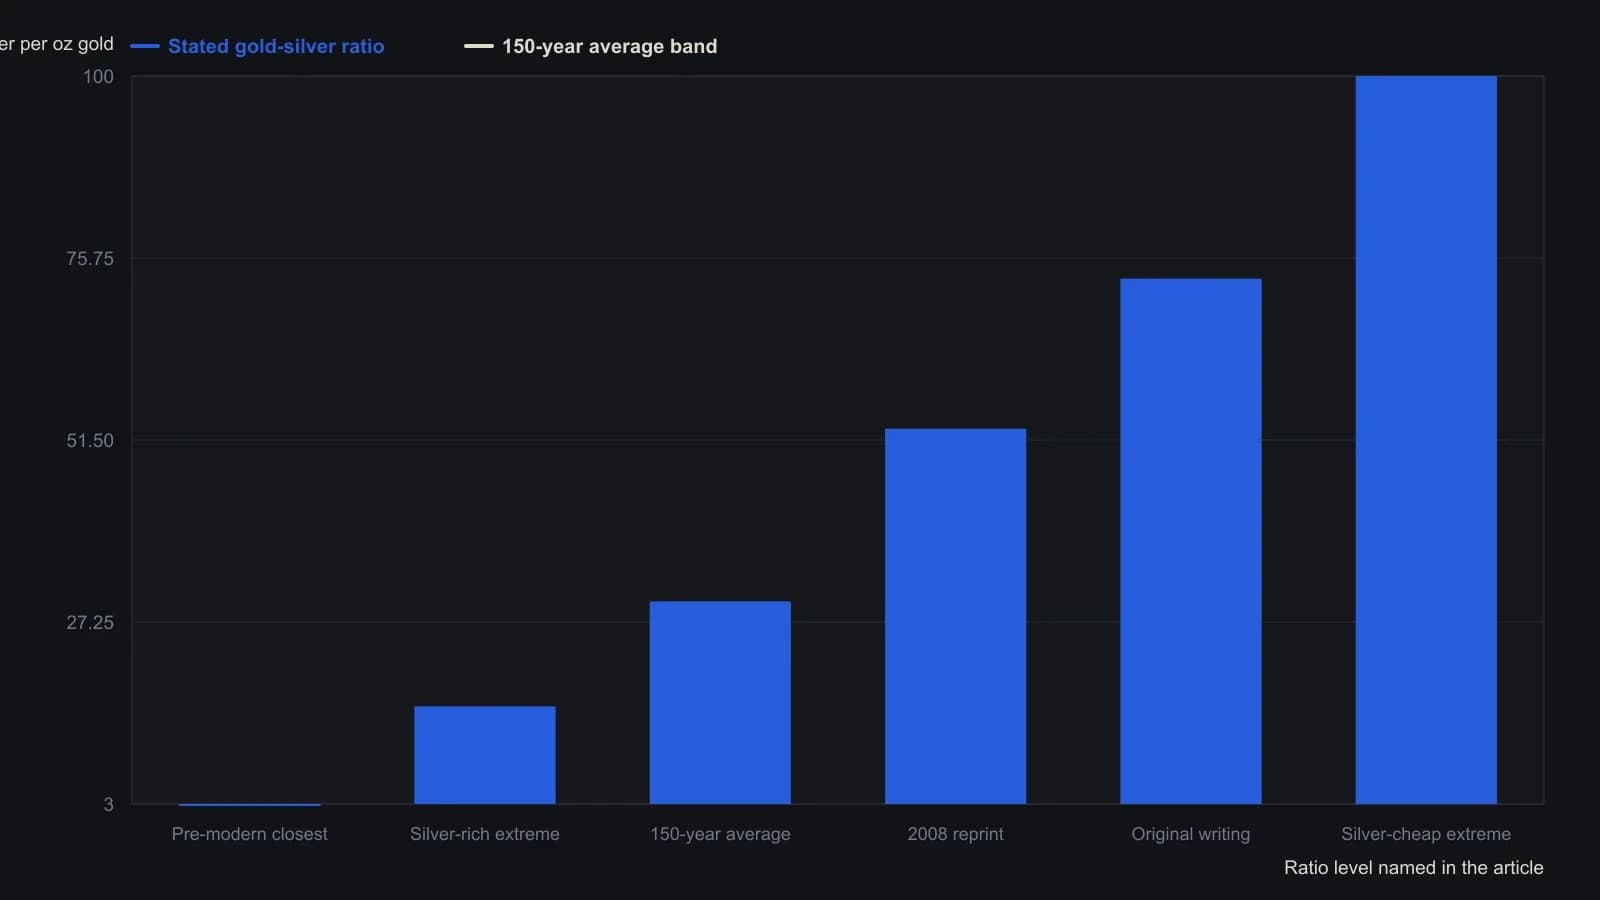
Each level is the author’s hedged prose figure (just below 3, about 16, close to 30, about 53, over 73, neighborhood of 100), not a dated table. In-ground abundance (~17 to 1) is omitted because it is not a price ratio.
Quiet while stretched, visible when it contracts
Mean reversion is framed as a pendulum that overshoots the midpoint, with a larger departure implying a more pronounced swing past the average. That is the archive workflow for mean-reversion overshoot.
The long suppression is analogized to water drawn from a bay before a surge. The ratio stays quiet while stretched and becomes visible only as it starts to contract.
Worked prices with gold unchanged
With gold at 350 and silver at 5, unchanged gold at 30 to 1 implies silver above 11.60, and at 16 to 1 implies silver near 22.
Silver is said to reprice 2.33 times as fast toward the average and more than four times as fast toward that closer extreme.
An undated turn
A later note records gold near 936, silver near 17.70, and the ratio down from above 73 to 1 to about 53 to 1. The turn itself is left undated.
Delayed speculative participation is tied to memory of the January 1980 squeeze. One 1997 holding of 130 million ounces is cited as an early large purchase.
All readings on this track · 26 readings
- 1984Three-gate confirmation for wave, ratio, and cycle turns
- 1988Triaging Elliott wave counts with weekly stochastic divergences
- 1989Dominant-cycle phase flips as regime tests
- 1989Audit signals against elasticity regimes
- 1990When wave counts fail the exclusion test
- 1991Evaluating hourly DJIA growth-rate and velocity attractors
- 1996If a terminal fifth is rewritten, fail the first count
- 1998Mapping industrial-average swings with Fibonacci growth and retracements
- 1999Define the stop before the wave or the divergence
- 2001Form-first Elliott wave construction with phi
- 2006Wave count, channel floor, and Fibonacci bands after a correction
- 2007Impulse and correction as a recursive fractal recipe
- 2008Gold-silver ratio as a shoreline wave
- 2008A daily chart trend filter with Elliott wave abstention
- 2010Revising Elliott wave counts with RSI and stochastic guides
- 2010Constructing corrective-wave hypotheses with Fibonacci retracements
- 2011Pre-commit the wave-and-ratio stop before entry
- 2012Dated wave and ratio cases need a later-sample test
- 2013Keep a 1-2-3 count only while zigzag, Fibonacci depth, and divergence still agree
- 2014Elliott-wave target versus the option bid-ask
- 2014A three-layer classroom on one daily futures chart
- 2015Elliott wave classifies the swing; trend following holds the trade
- 2016Constructing wave labels and retracement zones from chart structure
- 2017Sector ETF pairs in quiet regimes
- 2017A policy-shift case that tested a delayed long-cycle wave count
- 2018One role each for wave, Fibonacci, and stochastic