2014issue C0843-45
A three-layer classroom on one daily futures chart
A historical daily equity-index futures worksheet plotted a 10-day simple moving average through the series and a Fibonacci extension as labeled horizontal lines. Elliott wave analysis sat in a separately subscribed study module rather than among the default studies.
- The worksheet plotted a 10-day simple moving average through a daily equity-index futures series as the only illustrated study.
- A Fibonacci extension, one of 30 drawing tools, appeared on the same chart as a stack of horizontal lines with numeric labels at the right-hand end.
- Elliott wave analysis was offered through a separately subscribed study module, not as one of the 27 default studies.
- Alerts could attach to a price level, a drawn line, or a study, and bar interval was a style choice that included a 500-tick view of the same contract.
What the worksheet showed
A daily equity-index futures chart was shown with a 10-day simple moving average plotted through the price series. A simple moving average is an arithmetic average of closes over a stated number of daily bars, and it was the illustrated study.
The same daily chart displayed a Fibonacci extension as a stack of horizontal lines with numeric labels at the right-hand end. The illustrated pairing used one study, the 10-day simple moving average, and one of 30 drawing tools, the Fibonacci extension.
Elliott wave analysis was offered through a separately subscribed study module, not as one of the 27 default studies.
The moving-average baseline
A moving average is a fixed-lookback mean of ordered prices plotted through the series as an explicit quantitative baseline. In the worksheet that baseline was the 10-day simple moving average.
The average is a study drawn through the closes. It can be read as its own quantitative path before any ratio ladder or wave label is added.
The Fibonacci extension ladder
Fibonacci retracement, as used here, is swing-based ratio geometry on an OHLC chart. In this case the drawn form is an extension ladder of labeled horizontal levels.
The archive placed that ladder on the same daily chart, with numeric labels at the right-hand end. It was applied as a drawing tool, not as a plotted study.
Fibonacci extension prices on the daily e-mini S&P
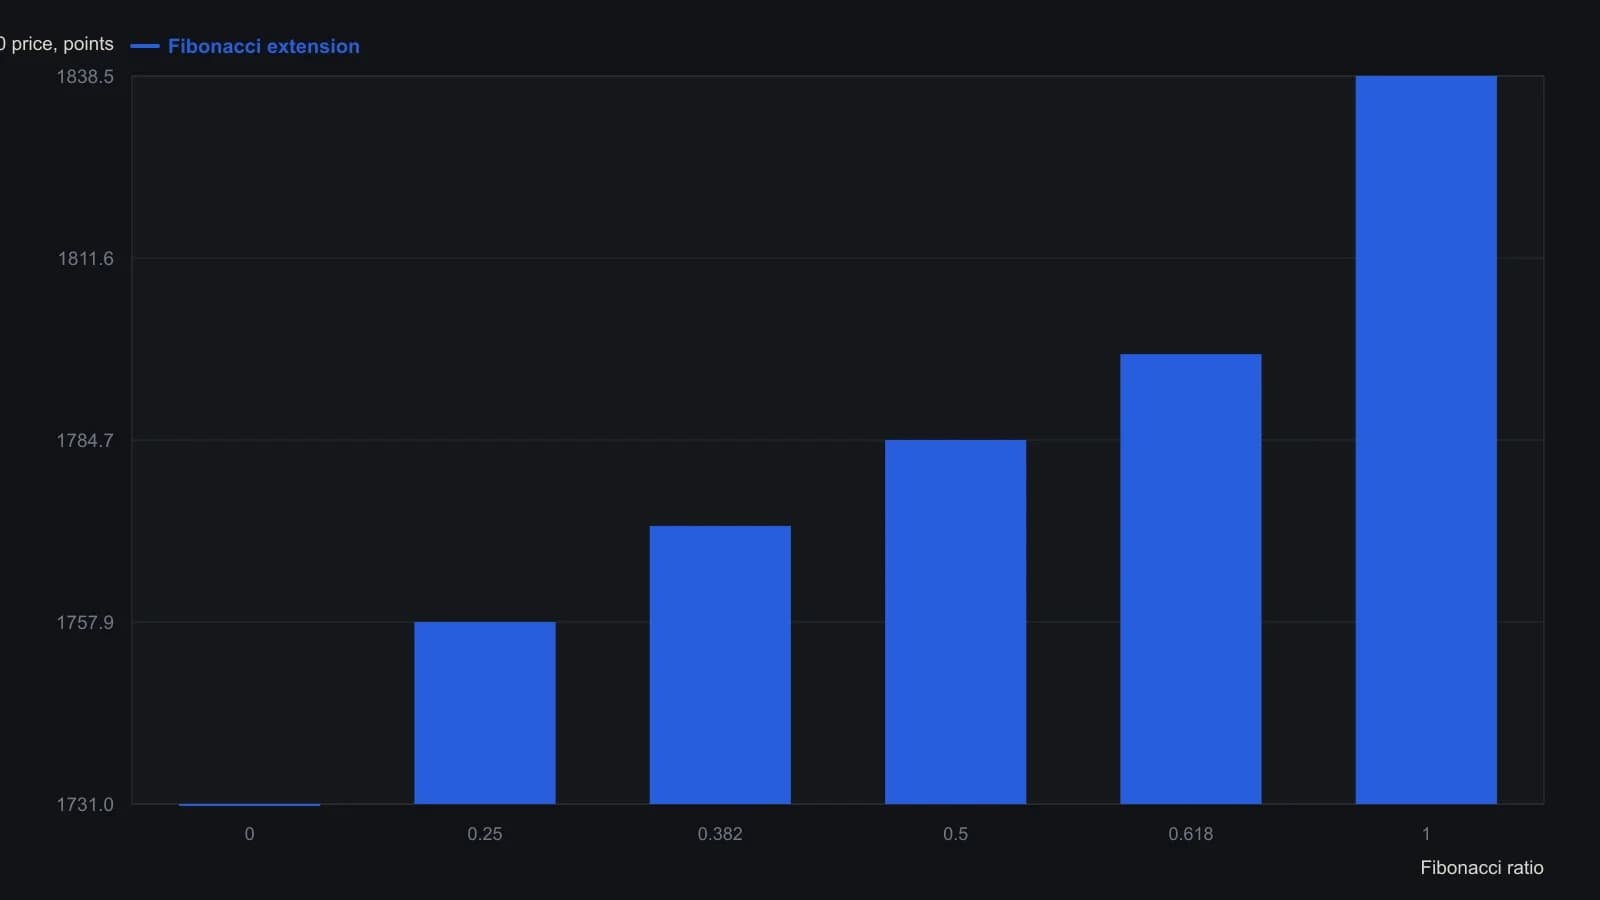
The same daily worksheet also plotted a 10-day simple moving average, 1800.83 on the 26 December 2013 bar (open 1830.00, high 1837.75, low 1829.75, close 1836.50). A 1.618 extension line sits near 1900 but its printed price was not readable with the same certainty, so that step is omitted.
The Elliott wave module
Elliott wave analysis is a labeled impulsive-and-corrective structure read from the same price bars, supplied here as a dedicated study module rather than a default overlay. It was not among the 27 default studies.
The illustrated pairing on the daily chart was the simple moving average and the Fibonacci extension. The wave module is a separate subscription path for reading structure from those bars.
Alerts and bar interval
Alerts could be attached to a price level, a drawn line, or a study such as a simple moving average. Those attachments sit on the shared chart, not inside any one overlay.
Bar interval was treated as a style choice: daily bars for swing work, and shorter or non-time bars for intraday work. A non-time bar is a bar closed by trade count, price range, or volume rather than a clock interval. The same futures contract was also shown as a 500-tick chart.
All readings on this track · 26 readings
- 1984Three-gate confirmation for wave, ratio, and cycle turns
- 1988Triaging Elliott wave counts with weekly stochastic divergences
- 1989Dominant-cycle phase flips as regime tests
- 1989Audit signals against elasticity regimes
- 1990When wave counts fail the exclusion test
- 1991Evaluating hourly DJIA growth-rate and velocity attractors
- 1996If a terminal fifth is rewritten, fail the first count
- 1998Mapping industrial-average swings with Fibonacci growth and retracements
- 1999Define the stop before the wave or the divergence
- 2001Form-first Elliott wave construction with phi
- 2006Wave count, channel floor, and Fibonacci bands after a correction
- 2007Impulse and correction as a recursive fractal recipe
- 2008Gold-silver ratio as a shoreline wave
- 2008A daily chart trend filter with Elliott wave abstention
- 2010Revising Elliott wave counts with RSI and stochastic guides
- 2010Constructing corrective-wave hypotheses with Fibonacci retracements
- 2011Pre-commit the wave-and-ratio stop before entry
- 2012Dated wave and ratio cases need a later-sample test
- 2013Keep a 1-2-3 count only while zigzag, Fibonacci depth, and divergence still agree
- 2014Elliott-wave target versus the option bid-ask
- 2014A three-layer classroom on one daily futures chart
- 2015Elliott wave classifies the swing; trend following holds the trade
- 2016Constructing wave labels and retracement zones from chart structure
- 2017Sector ETF pairs in quiet regimes
- 2017A policy-shift case that tested a delayed long-cycle wave count
- 2018One role each for wave, Fibonacci, and stochastic