2017issue C0622-25
A policy-shift case that tested a delayed long-cycle wave count
A 2017 wave-and-ratio case study treated a possible 2010 lending-rule rollback as a reason a long-cycle correction dated around 2019 might be delayed rather than cancelled. Elliott wave analysis, a Fibonacci extension, and Relative Strength Index confirmation were then read as conditions that could be accepted or rejected on the same Dow Jones Industrial Average charts.
- A 2017 wave-and-ratio case study treated a possible 2010 lending-rule rollback as a reason a long-cycle correction dated around 2019 might be delayed rather than cancelled.
- The case mapped a labeled fourth-wave decline onto a long-cycle sell window and treated a later fifth-wave advance as the path that could carry the Dow Jones Industrial Average to new highs before that window.
- A weekly Elliott count treated a 2016 low as the start of a fifth wave and used a 61.8 percent Fibonacci extension of the prior third wave as a 23700 objective.
- A rising weekly 14-period Relative Strength Index, and a monthly 14-period Relative Strength Index turning up and retesting the 70 line, were read as confirmation that the fifth-wave advance, including a possible top near 27784, could still develop.
A delayed cycle, not a cancelled one
A 2017 wave-and-ratio case study treated a possible 2010 lending-rule rollback as a reason a long-cycle correction dated around 2019 might be delayed rather than cancelled.
The same case mapped a labeled fourth-wave decline onto a long-cycle sell window. It treated a subsequent fifth-wave advance as the path that could carry the Dow Jones Industrial Average to new highs before that window.
Weekly Elliott wave analysis and the Fibonacci objective
A weekly Elliott count on the Dow Jones Industrial Average treated a 2016 low as the start of a fifth wave. The case used a 61.8 percent Fibonacci extension of the prior third wave as a 23700 objective.
A 14-period Relative Strength Index on that weekly chart was read as remaining in a rising trend. The case used that reading as confirmation that the fifth-wave advance could still develop.
Monthly Relative Strength Index confirmation
On the monthly chart, a 14-period Relative Strength Index turning up from a downtrend and retesting the 70 line was treated as a positive confirmation that a fifth-wave top near 27784 remained possible.
Monthly DJIA Wave 5 objectives from the 2017 Elliott count
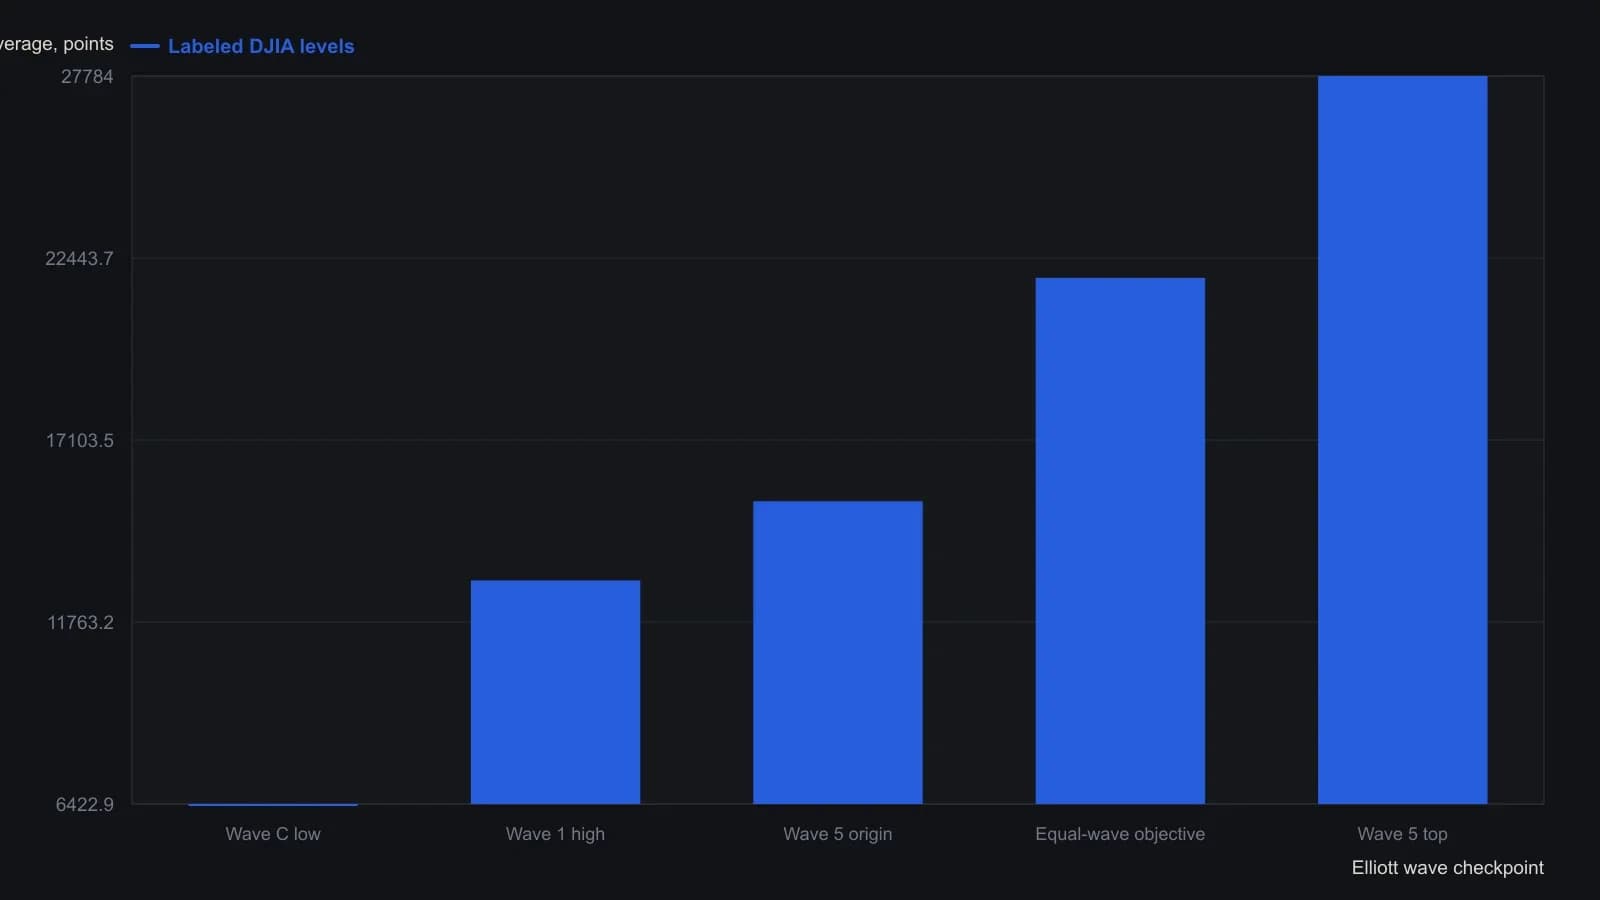
Wave 1 length is 12980 minus 6422.91. Adding that length to 15304.16 yields 21861.25. The 27784 print is the author’s projected monthly Wave 5 top, not an observed high. RSI 14, 7, 3 retesting 70 is the confirmation the article required and is not plotted here.
Editorial reading: a same-chart checklist
Editorial interpretation: Elliott wave analysis, Fibonacci retracement, and the Relative Strength Index turn the delayed-cycle idea into conditions that can be checked on the same charts. The hypothesis remains acceptable while the weekly fifth-wave count from the 2016 low, the 23700 Fibonacci extension of the prior third wave, and the weekly and monthly Relative Strength Index confirmations still hold.
Editorial interpretation: those conditions can be rejected on the same Dow Jones Industrial Average charts if the wave count, the Fibonacci retracement extension, or the Relative Strength Index confirmation no longer fits. That accept-or-reject reading is a TradersWeek framing, not an archive claim.
All readings on this track · 26 readings
- 1984Three-gate confirmation for wave, ratio, and cycle turns
- 1988Triaging Elliott wave counts with weekly stochastic divergences
- 1989Dominant-cycle phase flips as regime tests
- 1989Audit signals against elasticity regimes
- 1990When wave counts fail the exclusion test
- 1991Evaluating hourly DJIA growth-rate and velocity attractors
- 1996If a terminal fifth is rewritten, fail the first count
- 1998Mapping industrial-average swings with Fibonacci growth and retracements
- 1999Define the stop before the wave or the divergence
- 2001Form-first Elliott wave construction with phi
- 2006Wave count, channel floor, and Fibonacci bands after a correction
- 2007Impulse and correction as a recursive fractal recipe
- 2008Gold-silver ratio as a shoreline wave
- 2008A daily chart trend filter with Elliott wave abstention
- 2010Revising Elliott wave counts with RSI and stochastic guides
- 2010Constructing corrective-wave hypotheses with Fibonacci retracements
- 2011Pre-commit the wave-and-ratio stop before entry
- 2012Dated wave and ratio cases need a later-sample test
- 2013Keep a 1-2-3 count only while zigzag, Fibonacci depth, and divergence still agree
- 2014Elliott-wave target versus the option bid-ask
- 2014A three-layer classroom on one daily futures chart
- 2015Elliott wave classifies the swing; trend following holds the trade
- 2016Constructing wave labels and retracement zones from chart structure
- 2017Sector ETF pairs in quiet regimes
- 2017A policy-shift case that tested a delayed long-cycle wave count
- 2018One role each for wave, Fibonacci, and stochastic