1989issue C111-7
Audit signals against elasticity regimes
Before keeping a dominant-cycle, trend-following, or elliott-wave reading, run a pre-trade elasticity audit: decide whether the tape is a dampening-cycle toward relative-equilibrium or an expanding-cycle away from it, then keep only the reading that still has a job in that regime.
- Using technical indicators assigns supply-and-demand properties, including elasticity that can change through time, to the observed price curve, and that change can stop a technical procedure from working.
- Relative-equilibrium means short-interval balance can coexist with long-interval change, and a brief disturbance can sit inside a longer stable stretch.
- Trend-following is described as succeeding in one elasticity regime and failing in the other; after most trends a dampening-cycle interval appears and raises whipsaw risk.
- A relocated demand curve can print shapes similar to an elasticity change, so expanding-cycle and dampening-cycle states are distinct regimes, not interchangeable chart labels.
Read the regime before the signal
Editorial. TradersWeek treats the archive as a historical workflow, not as a live playbook. The teaching frame is a pre-trade elasticity audit: first decide whether the tape is a dampening-cycle pulling toward relative-equilibrium or an expanding-cycle moving away from it, then keep only the dominant-cycle, trend-following, or elliott-wave reading that still has a job in that regime.
Using technical indicators assigns supply-and-demand properties, including elasticity that can change through time, to the observed price curve. That change can stop a technical procedure from working. Elasticity here means how strongly quantity demanded or supplied responds when price changes, and how that responsiveness itself can shift through time.
Disturbance, balance, and relative-equilibrium
The dynamic account treats markets as punctuated disturbances separated by equilibrium. A small news impulse can displace a market that is already balanced, while a recently disturbed market can absorb even large news with little lasting effect.
Equilibrium is relative across horizons. Short-interval balance can coexist with long-interval change, and a brief disturbance can sit inside a longer stable stretch. Relative-equilibrium is that split: balance that holds on one horizon while change or a brief disturbance continues on another.
Cobweb-adjustment is not tied to a crop year
A cobweb-adjustment loop, in which the latest price sets next-period quantity and that quantity then resets price, can be restated on horizons of hours, days, or weeks rather than only on a crop year.
Supply is pictured as less elastic as response time shortens. Futures quantity axes may not match physical yearly supply, because daily futures volume can approach a commodity's entire yearly physical supply. Quantity responses may also lag across later periods rather than reset in the next period.
Familiar shapes can still be random
Price paths generated from changing supply and demand curves can form wedges and head-and-shoulders while remaining statistically random. A large shock can settle, a later small cycle can start nearer equilibrium without an elasticity change, and elasticity can later shift then return to dampening.
A historical equity-crash sketch shows a dampening stretch, then expansion, then dampening after the break. The elasticity change may remain unclear until prices have already fallen through a trendline.
A relocated demand curve can print shapes similar to an elasticity change, so the live problem is telling those two regime events apart. In that crash sketch, an expected further expanding swing did not arrive and demand instead drifted higher over the following year.
Keep the reading that still has a job
Editorial. Dominant-cycle is the reading TradersWeek keeps first, because it states whether the tape is an expanding-cycle or a dampening-cycle over a stated sampling interval. The archive itself defines that reading as a quantitative baseline forecast of expanding or dampening oscillation produced by lagged supply and demand.
Trend-following is a rule family that stays with directional persistence and is tested as one procedure for entry, exit, and standing aside across holding periods. Those rules are described as succeeding in one elasticity regime and failing in the other. After most trends a dampening interval appears and raises whipsaw risk. Procedures that treat long-horizon supply and demand as gone can miss a later smooth trend once delayed adjustments arrive, as in historical crude and cocoa declines.
Elliott-wave is a numbered price-structure hypothesis that must remain falsifiable once it is placed inside a supply-and-demand regime rather than treated as a free-standing pattern label. Wave-count numbering is placed inside that setting, and expanding versus dampening states are treated as distinct cycle regimes rather than interchangeable chart labels.
NYSE tape through the 1987 crash
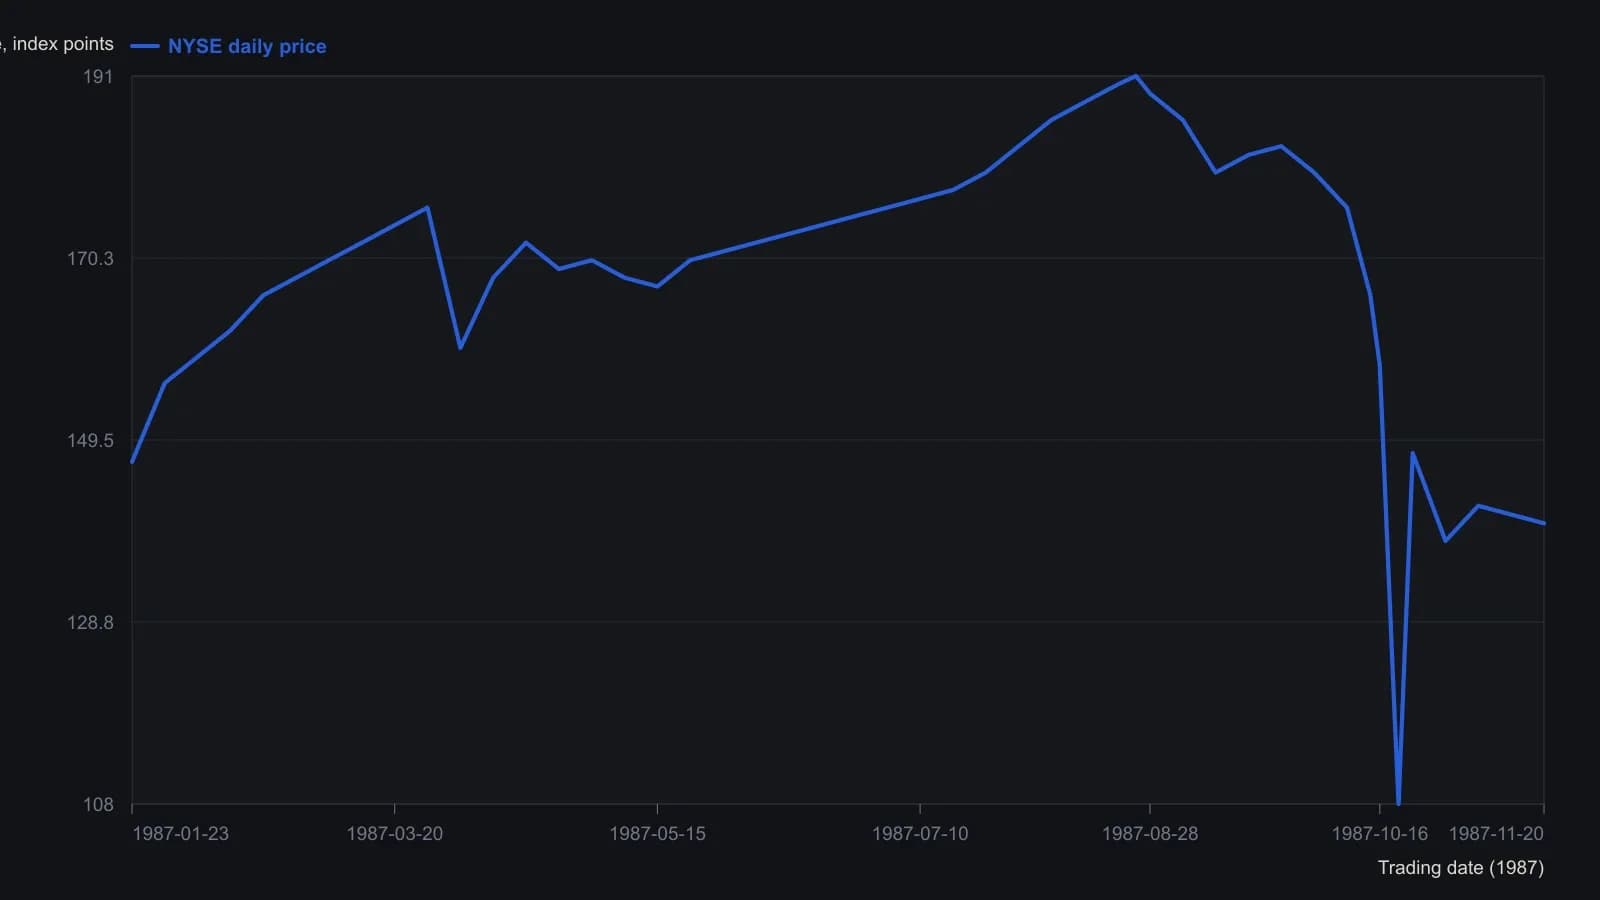
Prices were read from the plotted daily bars against the chart’s own 2-point grid, not from a printed table. The raster supports about 2-point accuracy; the printed extremes (high 25 Aug, low 108.00 on 20 Oct) were used as anchors. Volume and the three inset cobweb sketches were not digitized.
All readings on this track · 26 readings
- 1984Three-gate confirmation for wave, ratio, and cycle turns
- 1988Triaging Elliott wave counts with weekly stochastic divergences
- 1989Dominant-cycle phase flips as regime tests
- 1989Audit signals against elasticity regimes
- 1990When wave counts fail the exclusion test
- 1991Evaluating hourly DJIA growth-rate and velocity attractors
- 1996If a terminal fifth is rewritten, fail the first count
- 1998Mapping industrial-average swings with Fibonacci growth and retracements
- 1999Define the stop before the wave or the divergence
- 2001Form-first Elliott wave construction with phi
- 2006Wave count, channel floor, and Fibonacci bands after a correction
- 2007Impulse and correction as a recursive fractal recipe
- 2008Gold-silver ratio as a shoreline wave
- 2008A daily chart trend filter with Elliott wave abstention
- 2010Revising Elliott wave counts with RSI and stochastic guides
- 2010Constructing corrective-wave hypotheses with Fibonacci retracements
- 2011Pre-commit the wave-and-ratio stop before entry
- 2012Dated wave and ratio cases need a later-sample test
- 2013Keep a 1-2-3 count only while zigzag, Fibonacci depth, and divergence still agree
- 2014Elliott-wave target versus the option bid-ask
- 2014A three-layer classroom on one daily futures chart
- 2015Elliott wave classifies the swing; trend following holds the trade
- 2016Constructing wave labels and retracement zones from chart structure
- 2017Sector ETF pairs in quiet regimes
- 2017A policy-shift case that tested a delayed long-cycle wave count
- 2018One role each for wave, Fibonacci, and stochastic